Celsmar is the financial terminal to analyse companies, markets and your portfolio. Every figure with its date and source, and an AI that reads the chart with you.
Your chart, read the way a technical analyst would.
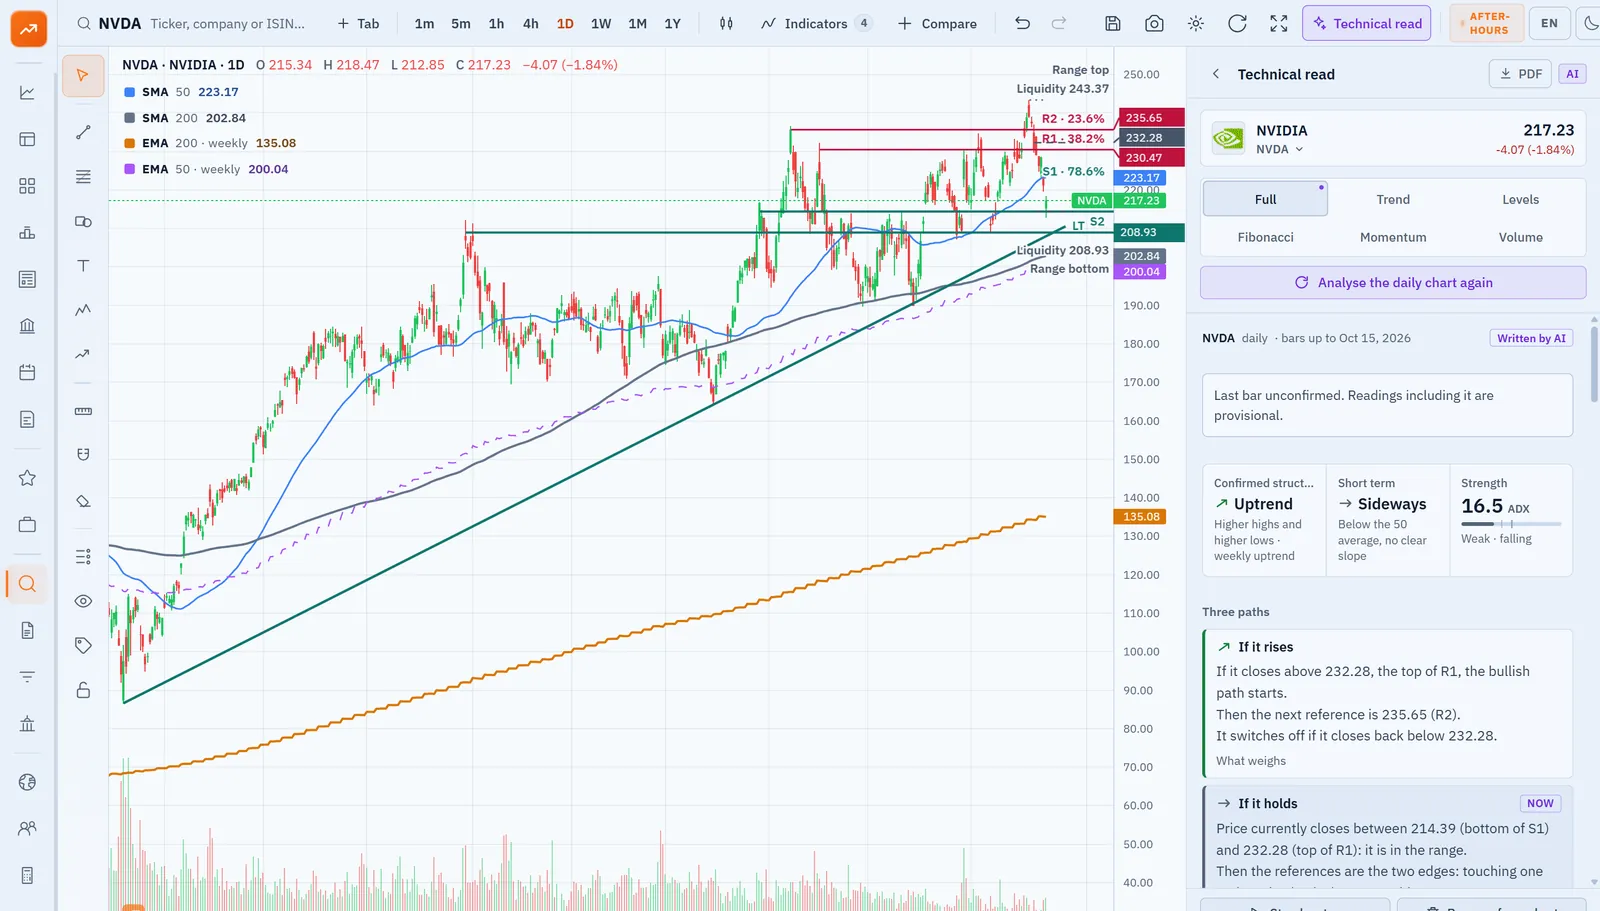
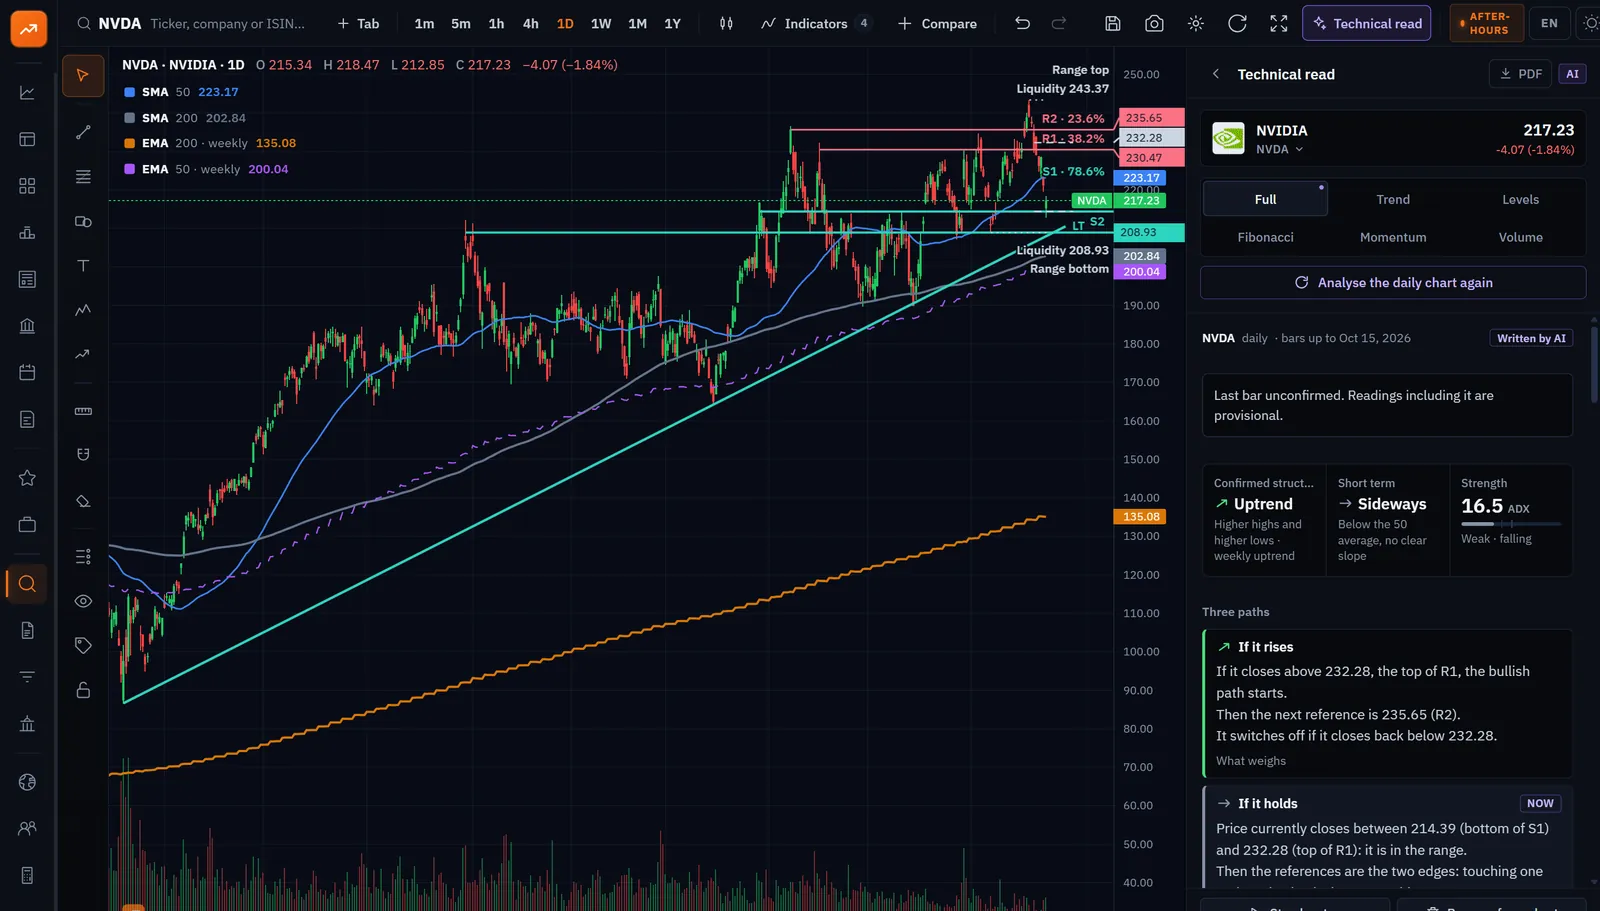
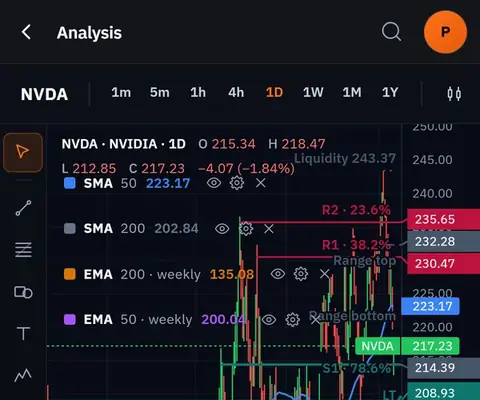
The AI draws the trend, supports and resistances, trendlines, Fibonacci retracements and volume right on the chart, and explains every line: why it is there and what would invalidate it. Six reading modes, from one hour to weekly.
Levels with real touches, not lines drawn by eye
Every drawing, with its explanation beside it
A descriptive reading: never a recommendation
Search a ticker, company or ISINCtrl K
NVDANVIDIA Corporation217.23−1.84%
✦AI technical reading↵ open
Technical readingNVDA · 217.23 −1.84%
Analysing NVDA · daily
0 %
Daily candles read
Confirmed uptrend: higher highs and higher lows
Trend strength (ADX): 16.5, weak and falling
2 supports and 2 resistances with real touches
Long-term bullish trendline
Fibonacci retracements: 23.6 · 38.2 · 78.6%
StructureUptrend
Short termSideways
Strength16.5 ADX
A replay of the real NVDA reading of 15 Oct 2026, exactly as the terminal returned it.
02 Fundamentals
The company accounts, complete and comparable.
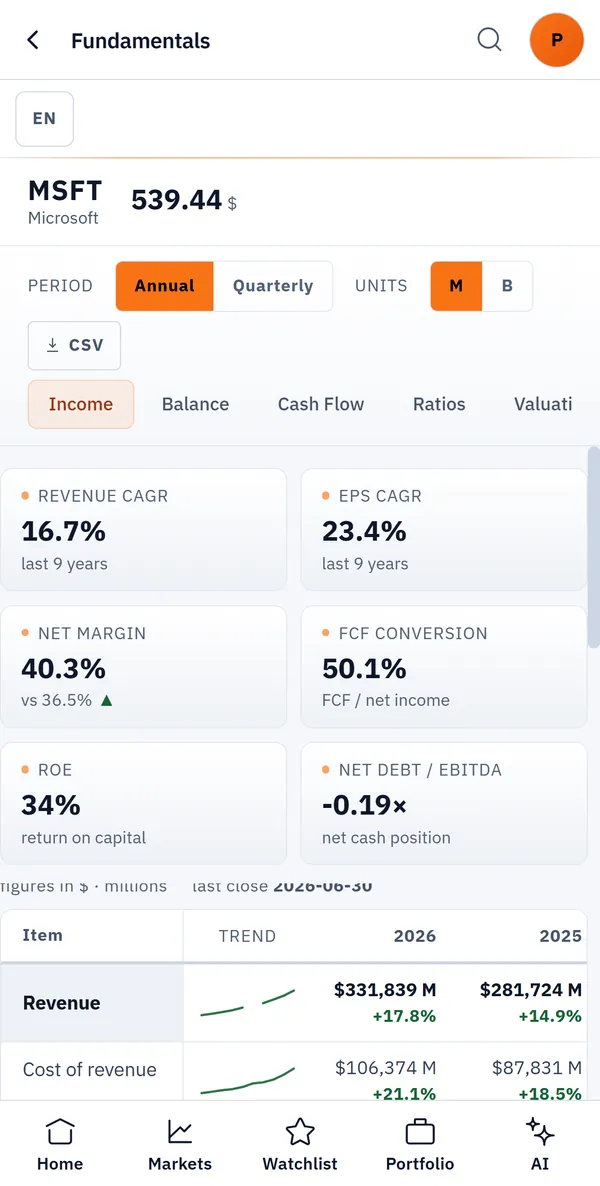
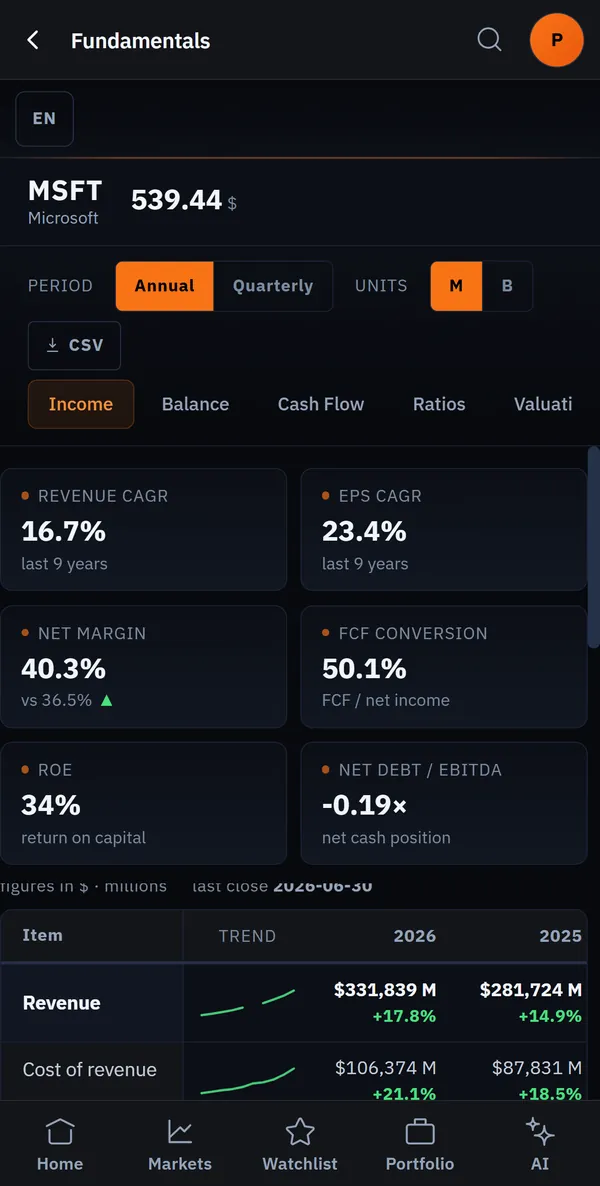
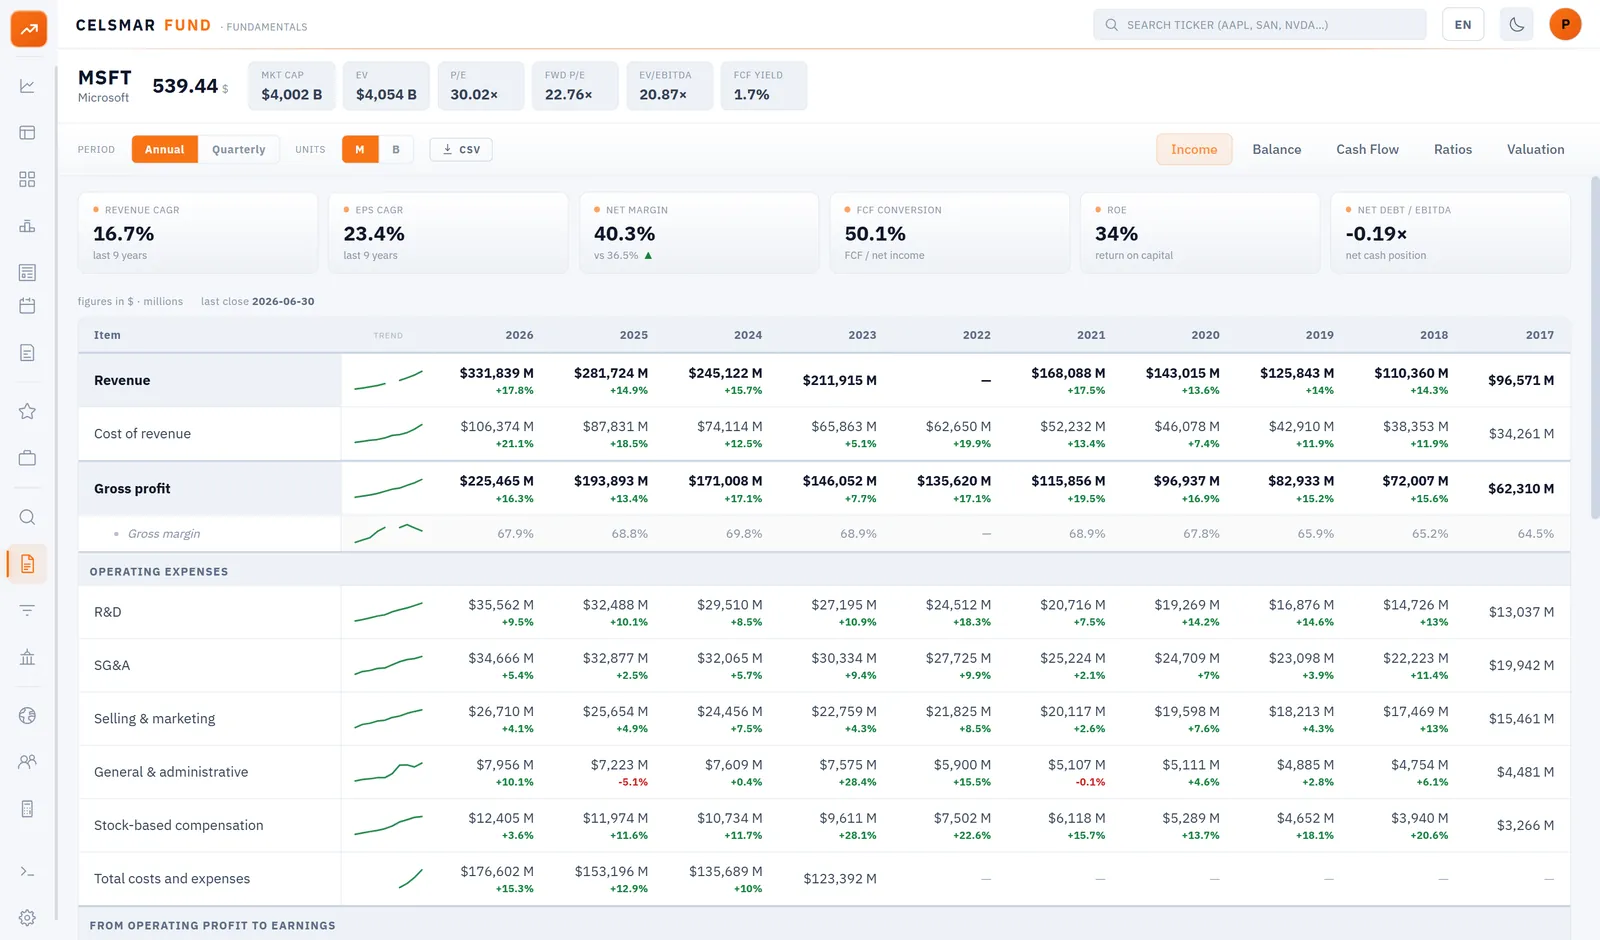
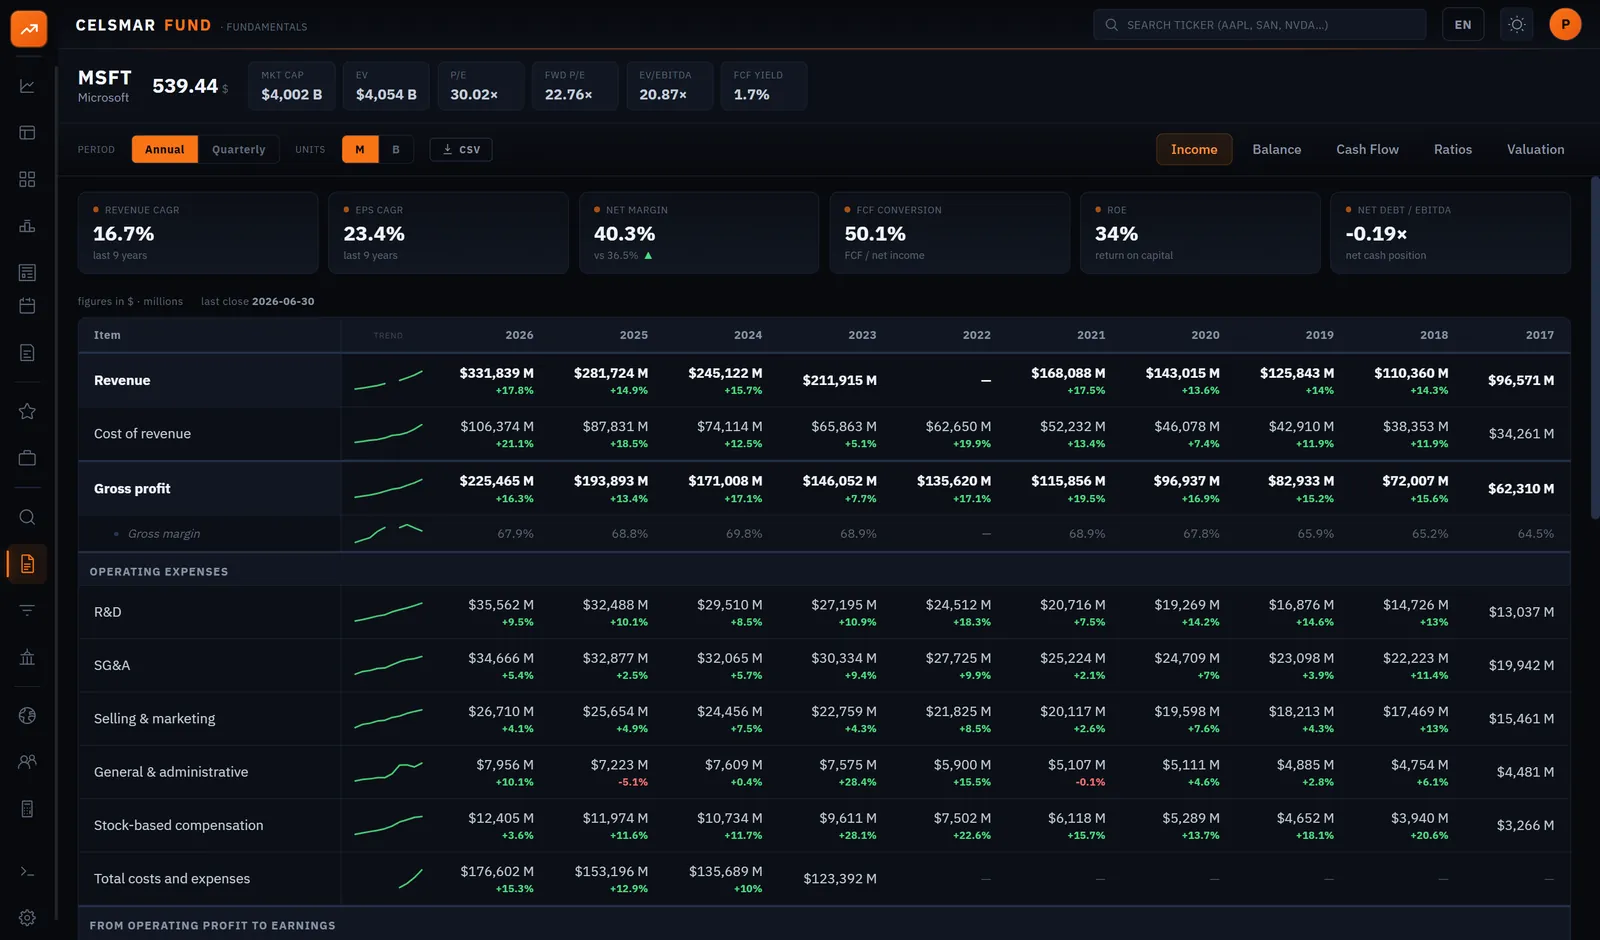
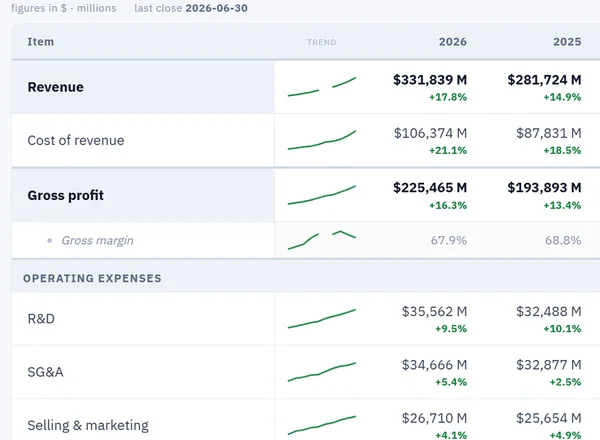
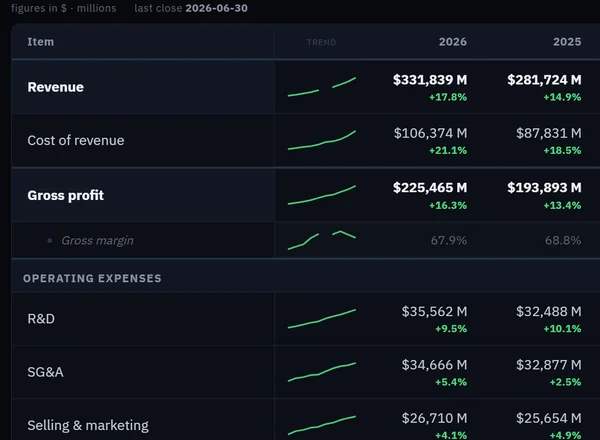
Income statement, balance sheet and cash flows by fiscal year or quarter, with the change in every line and its trend. Valuation and profitability ratios, computed on those same figures.
Annual or quarterly, in millions or billions
Date of the latest close always in view
Exportable to CSV
03 Ask the AI
Ask in your own words. It answers with today's data.
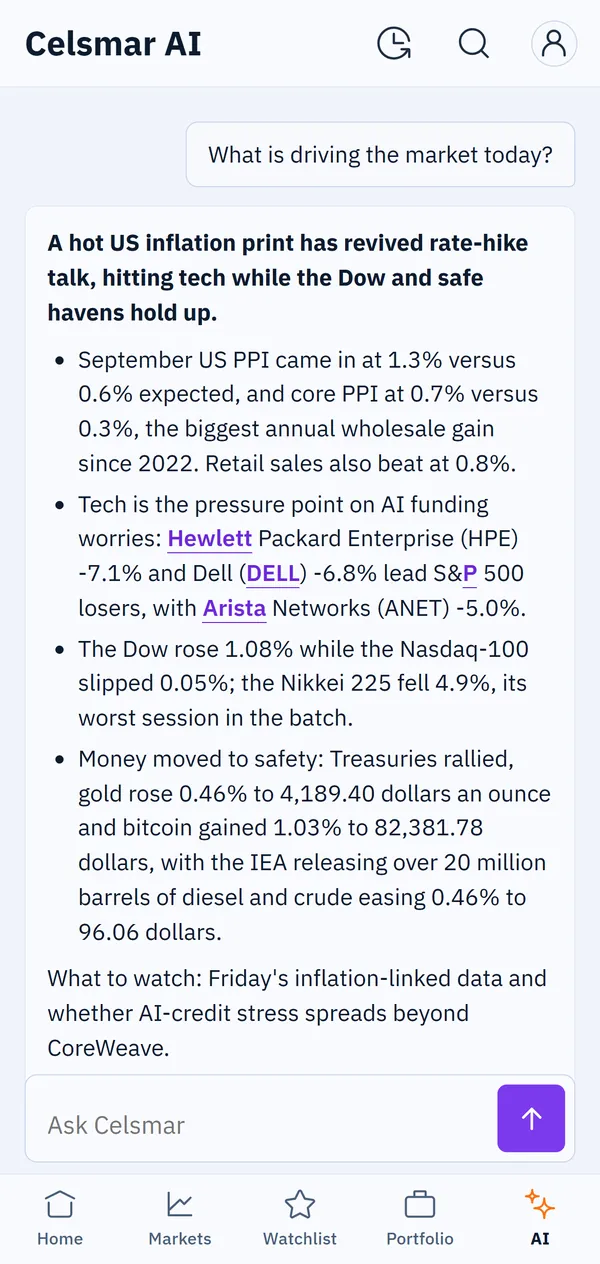
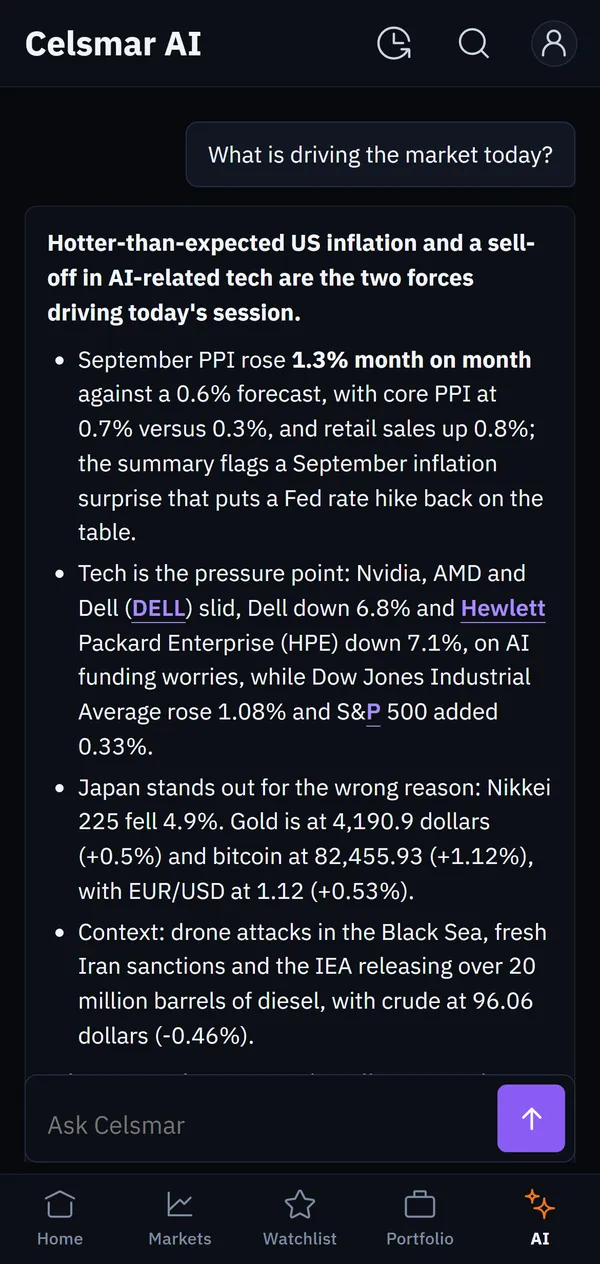
What is moving the market today, why a stock is falling, what risks your portfolio carries. The answer is built on the quotes and news you see in the terminal, with the figures cited, not invented.
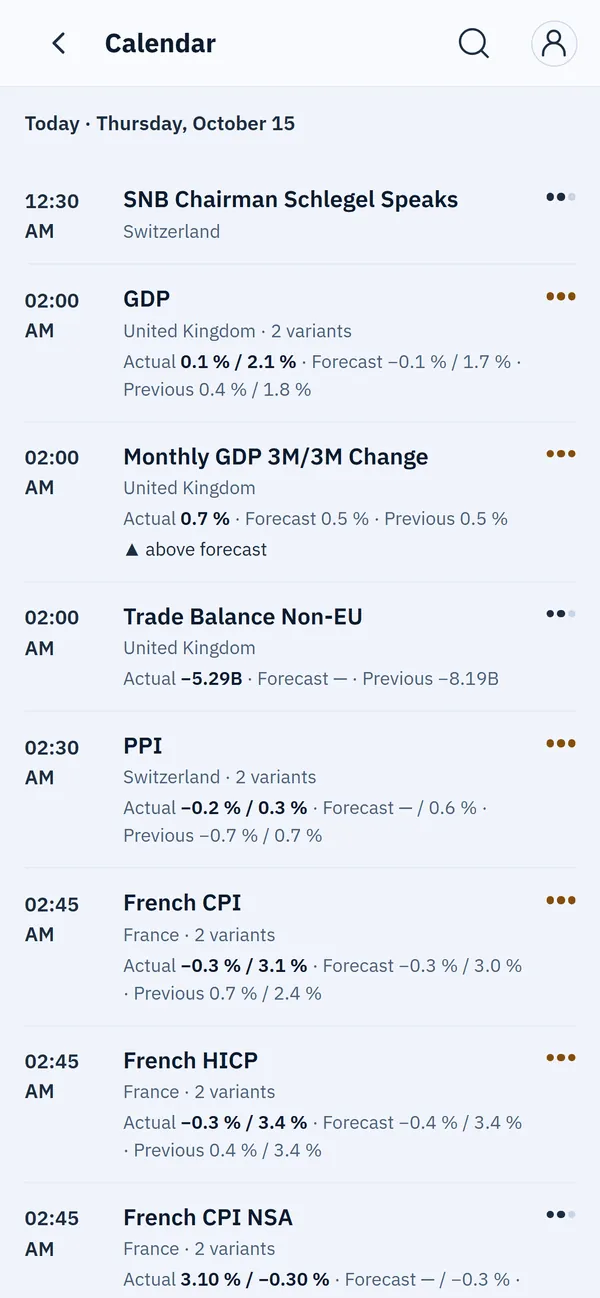
On mobile too, with the same account
Links every stock it mentions to its page
A clear weekly quota, no surprises
04 Markets
Indices, currencies, commodities, bonds and futures.
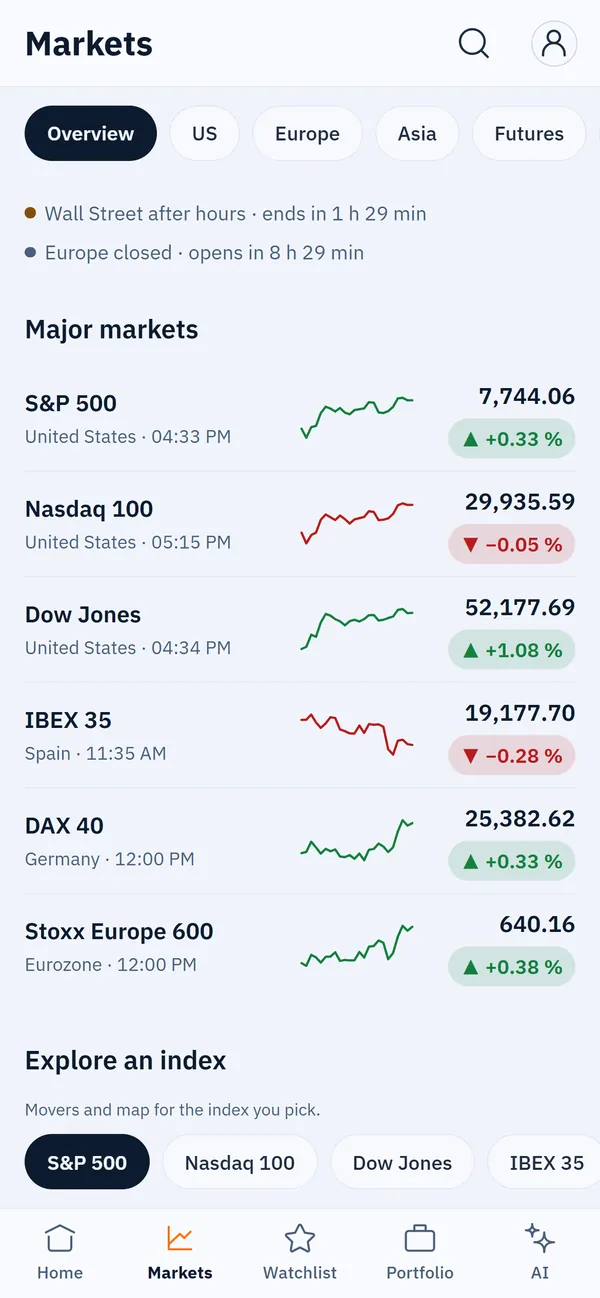
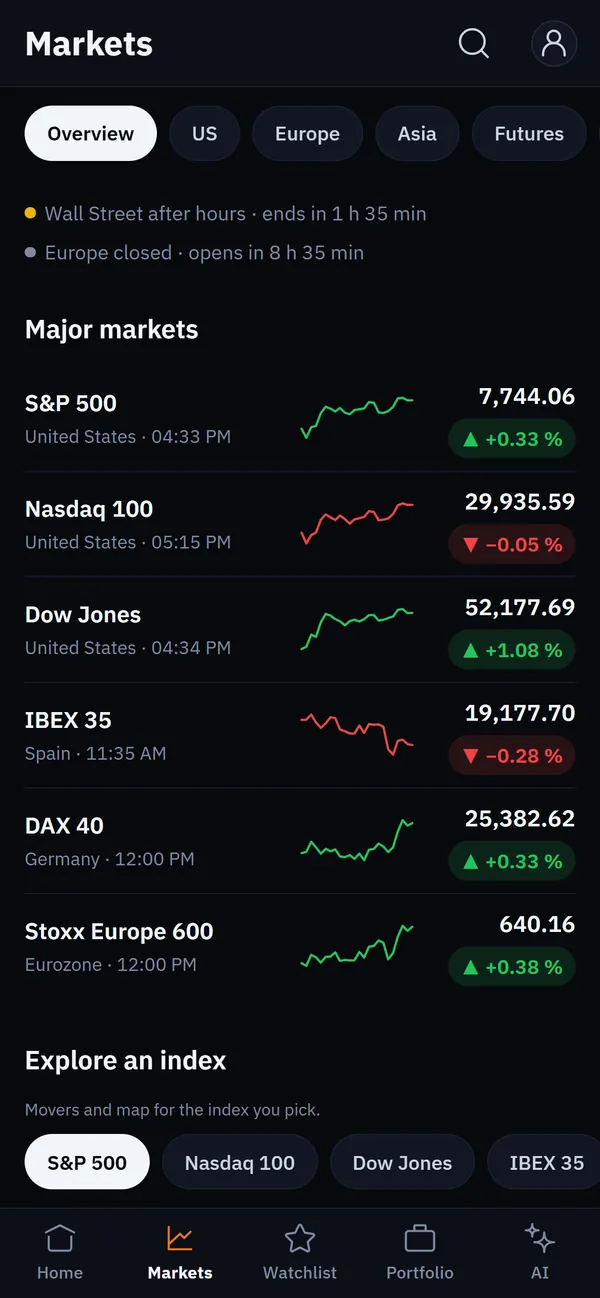
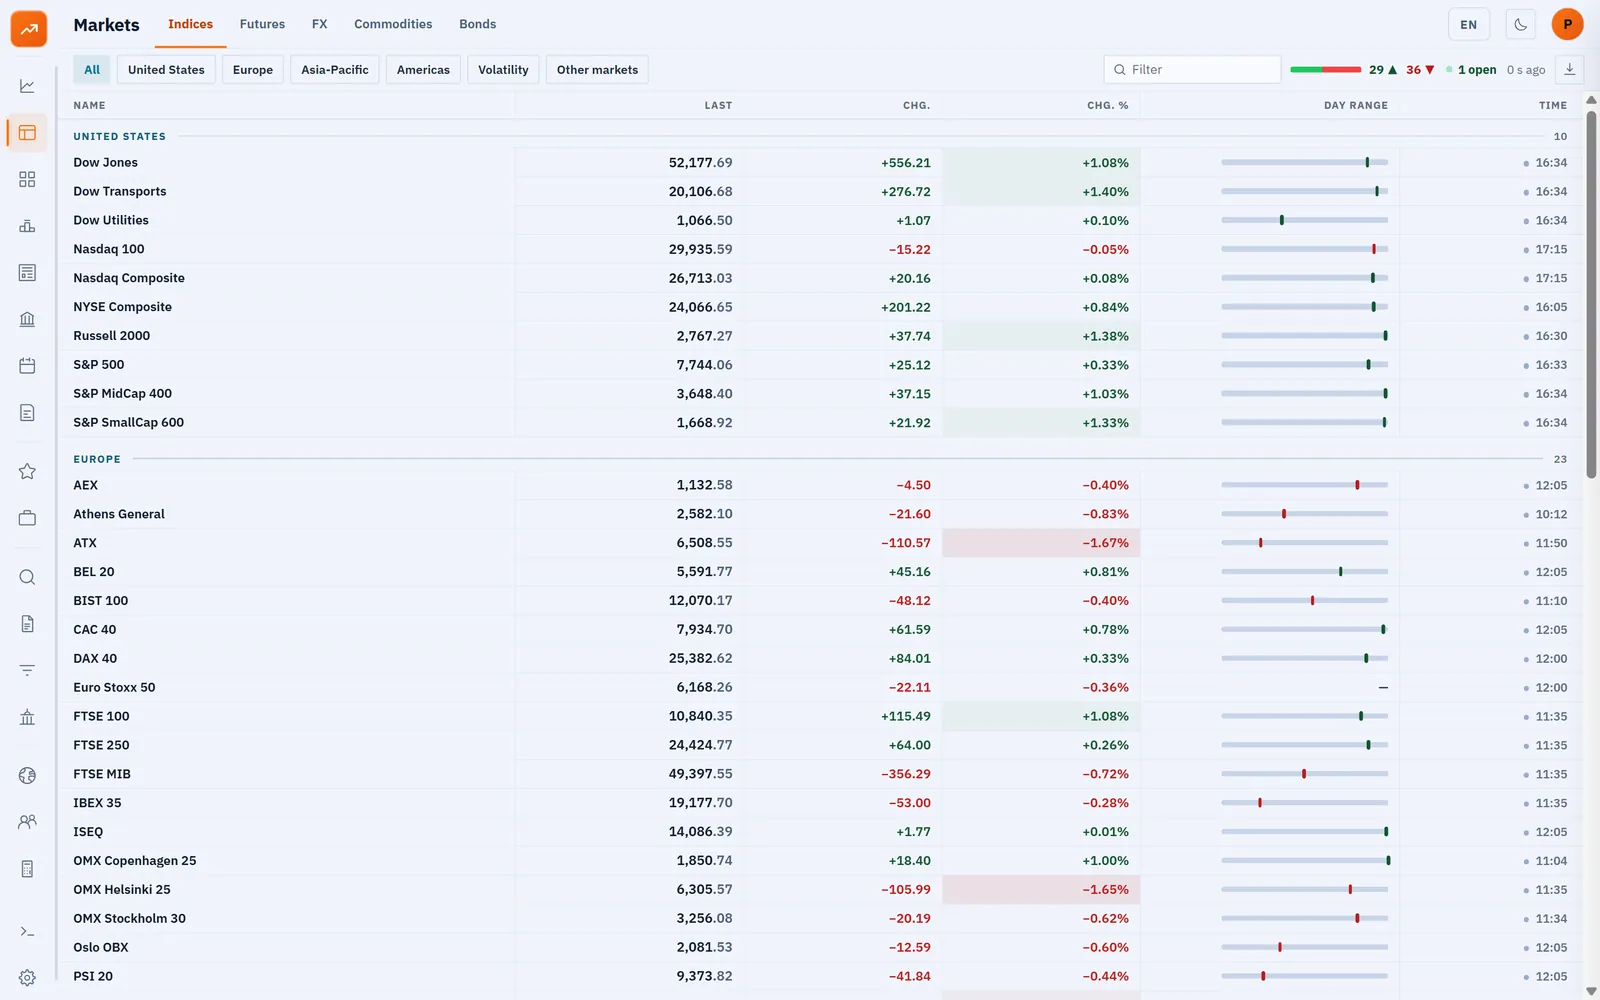
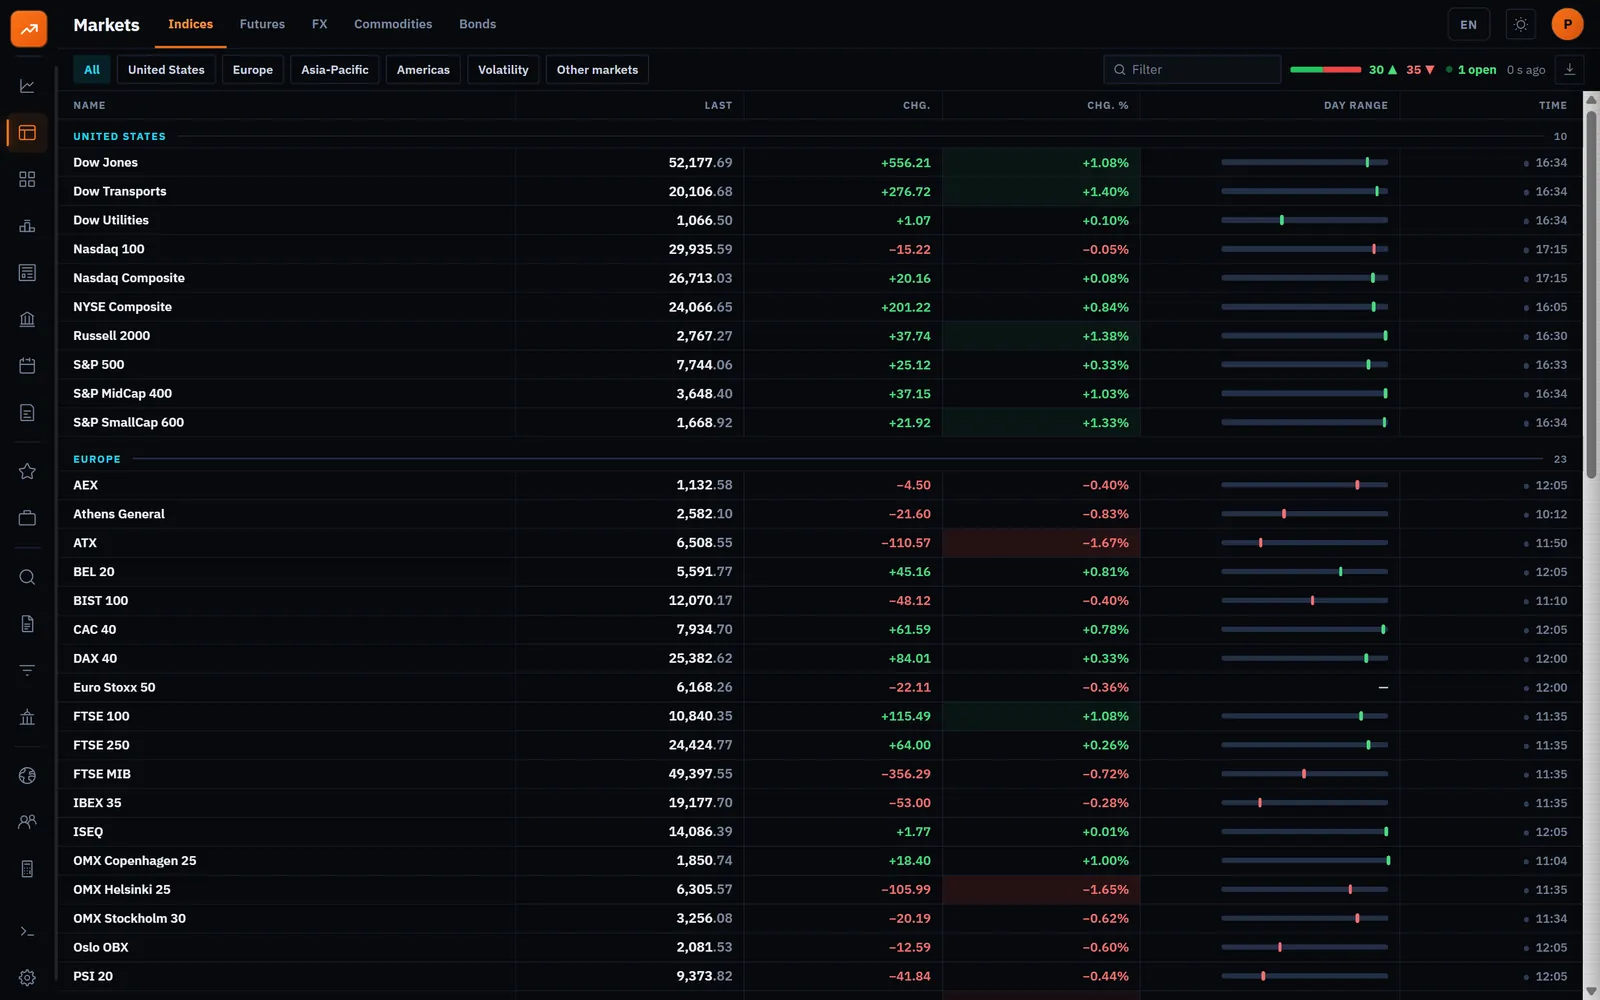
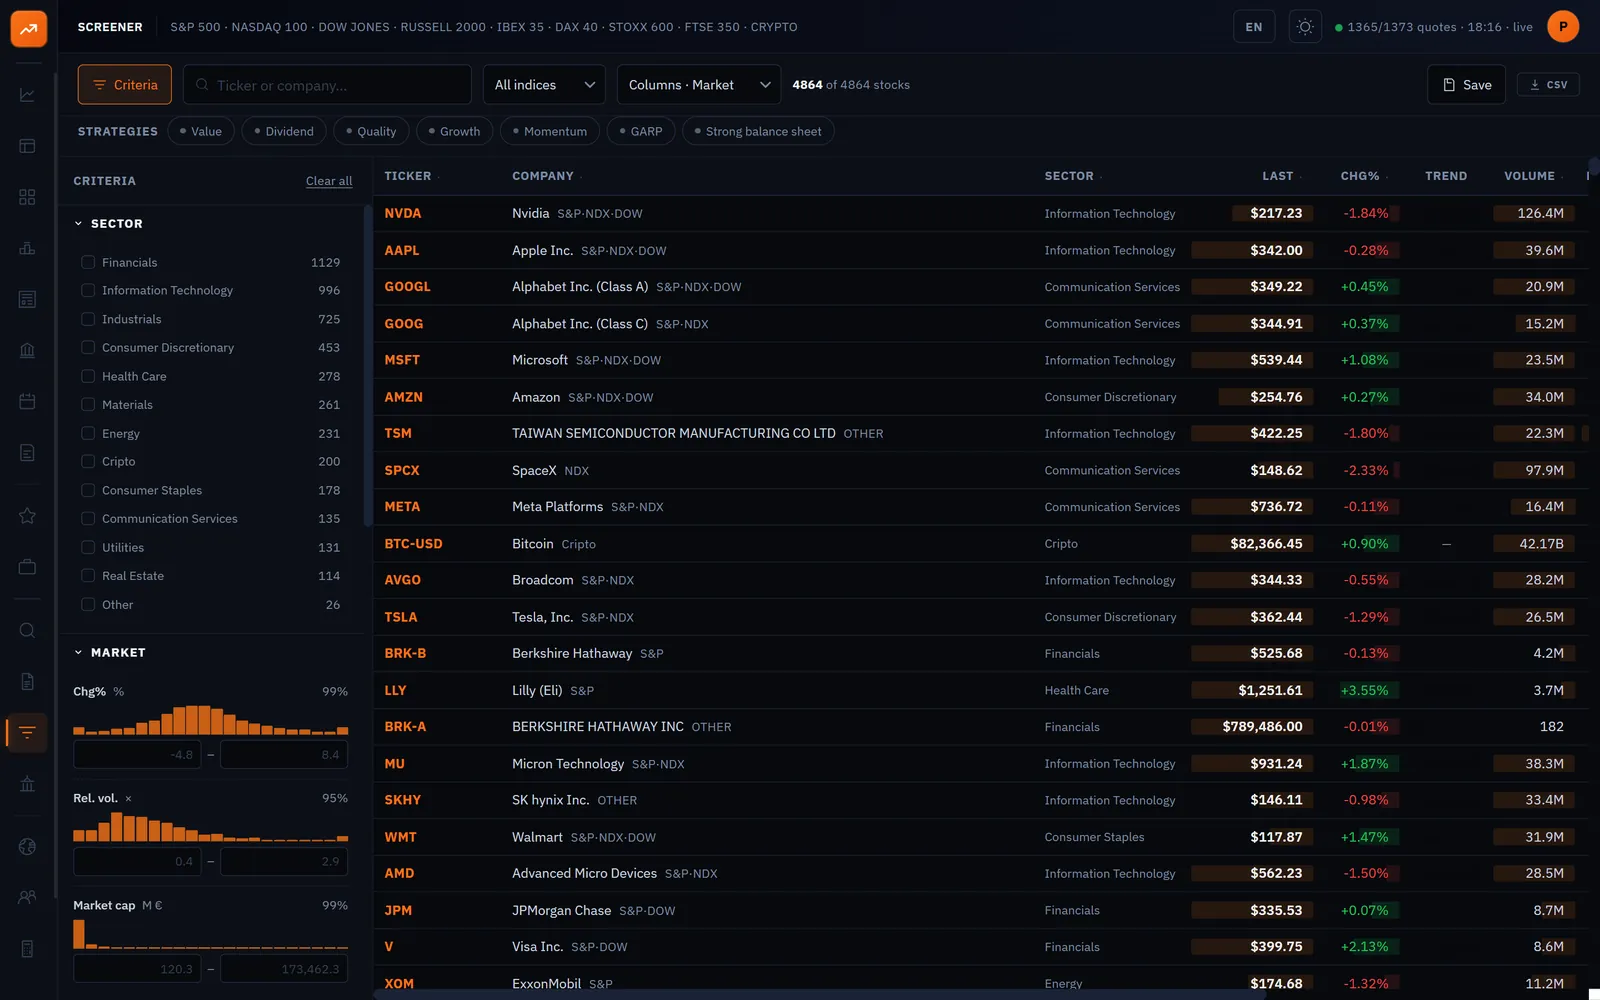
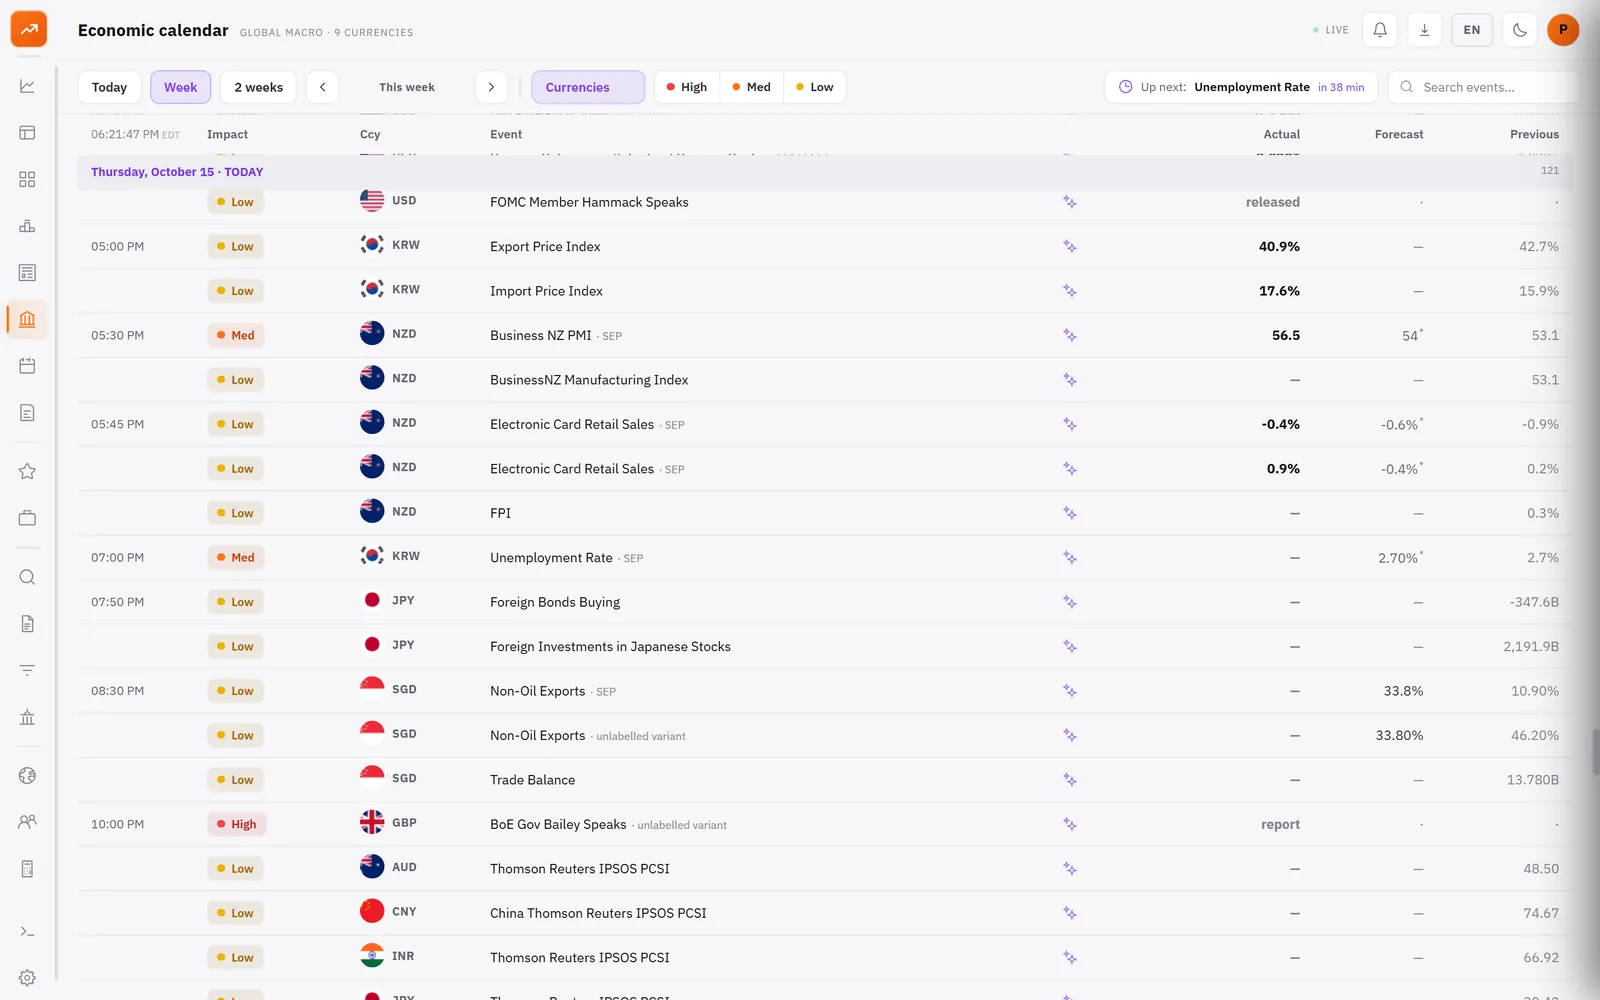
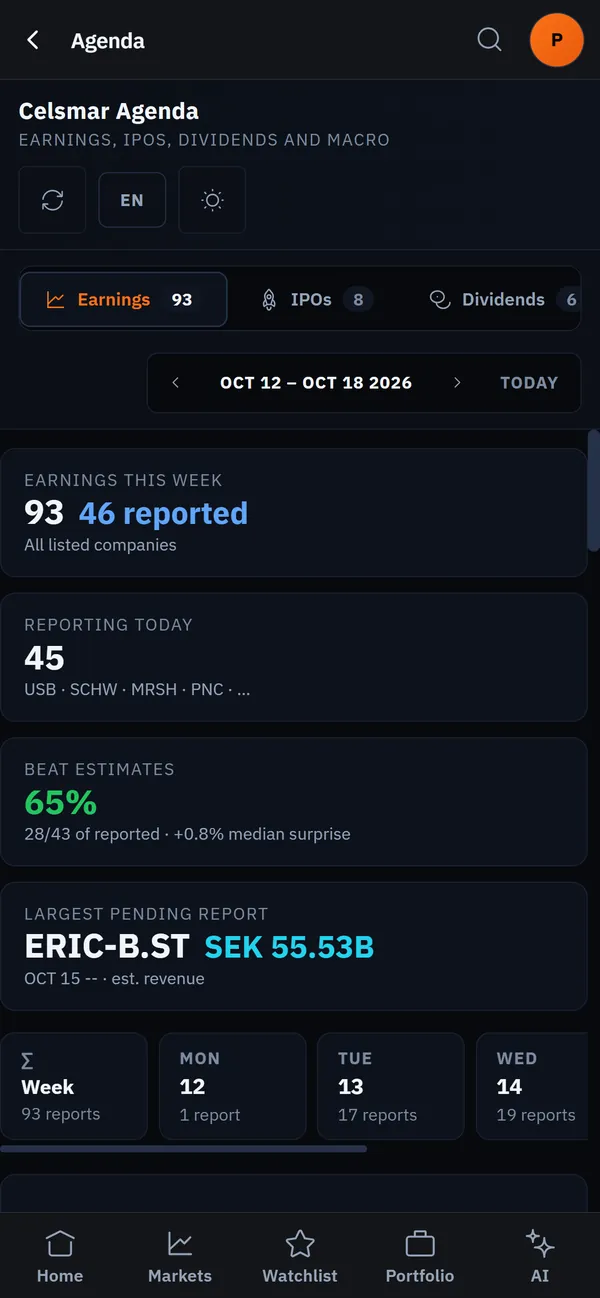
Five market desks on a single screen, grouped the way a professional would, with the day range and the time of every quote so you know whether a figure is live or from the last session.
The time of every price, always in view
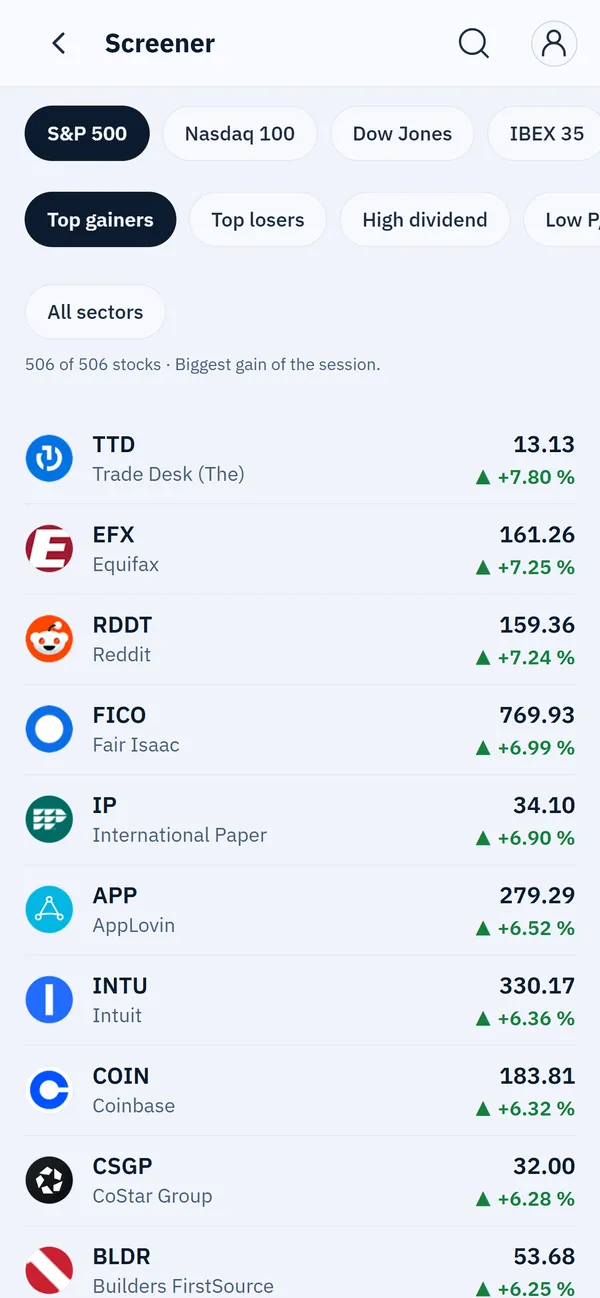
Filters by region and asset type
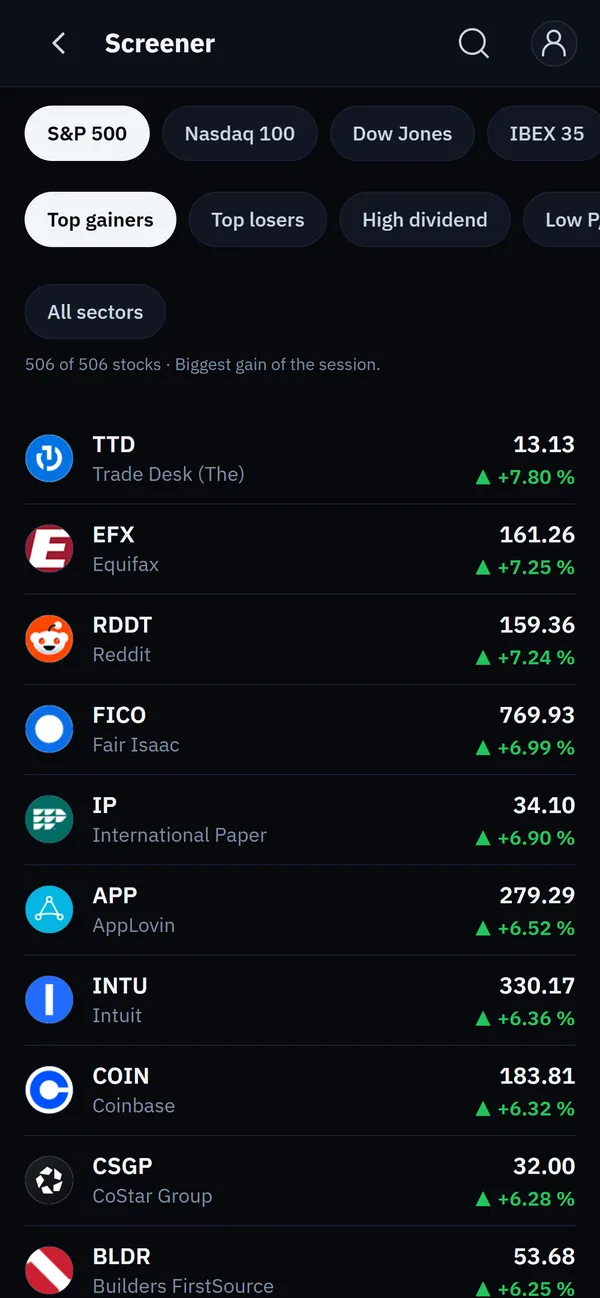
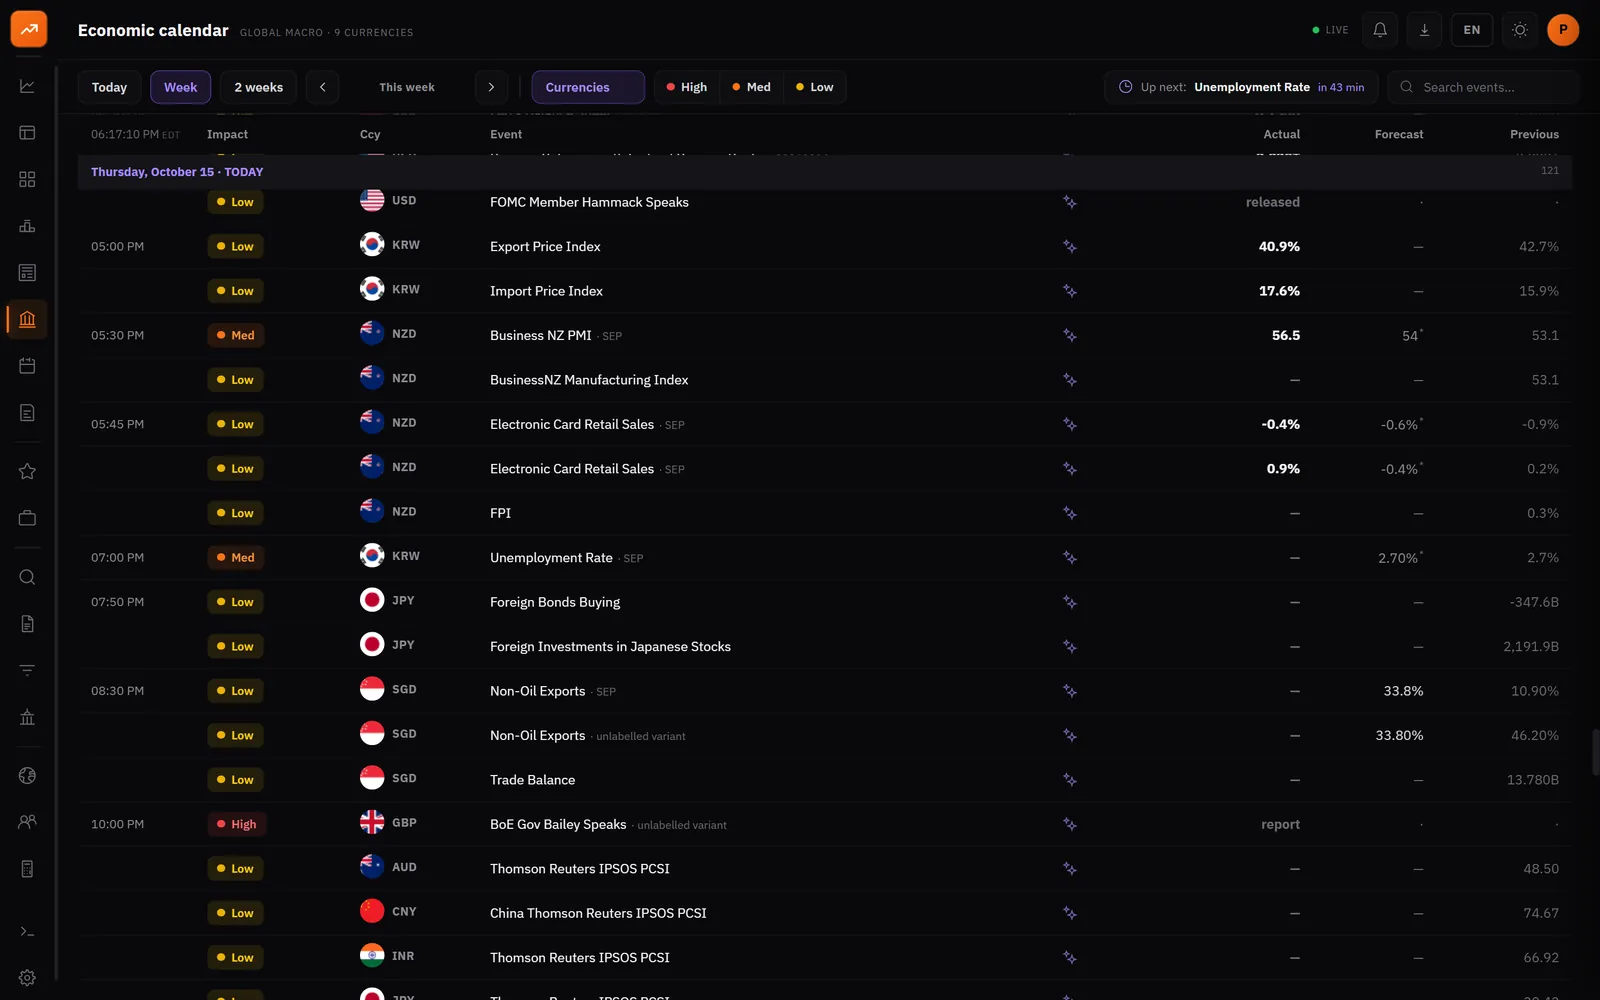
Real light and dark themes
Search a ticker, company or ISINCtrl K
NVDANVIDIA Corporation217.23−1.84%
✦AI technical reading↵ open
Technical readingNVDA · 217.23 −1.84%
Analysing NVDA · daily
0 %
Daily candles read
Confirmed uptrend: higher highs and higher lows
Trend strength (ADX): 16.5, weak and falling
2 supports and 2 resistances with real touches
Long-term bullish trendline
Fibonacci retracements: 23.6 · 38.2 · 78.6%
StructureUptrend
Short termSideways
Strength16.5 ADX
A replay of the real NVDA reading of 15 Oct 2026, exactly as the terminal returned it.
celsmar.com/fundamentals
celsmar.com/mercados
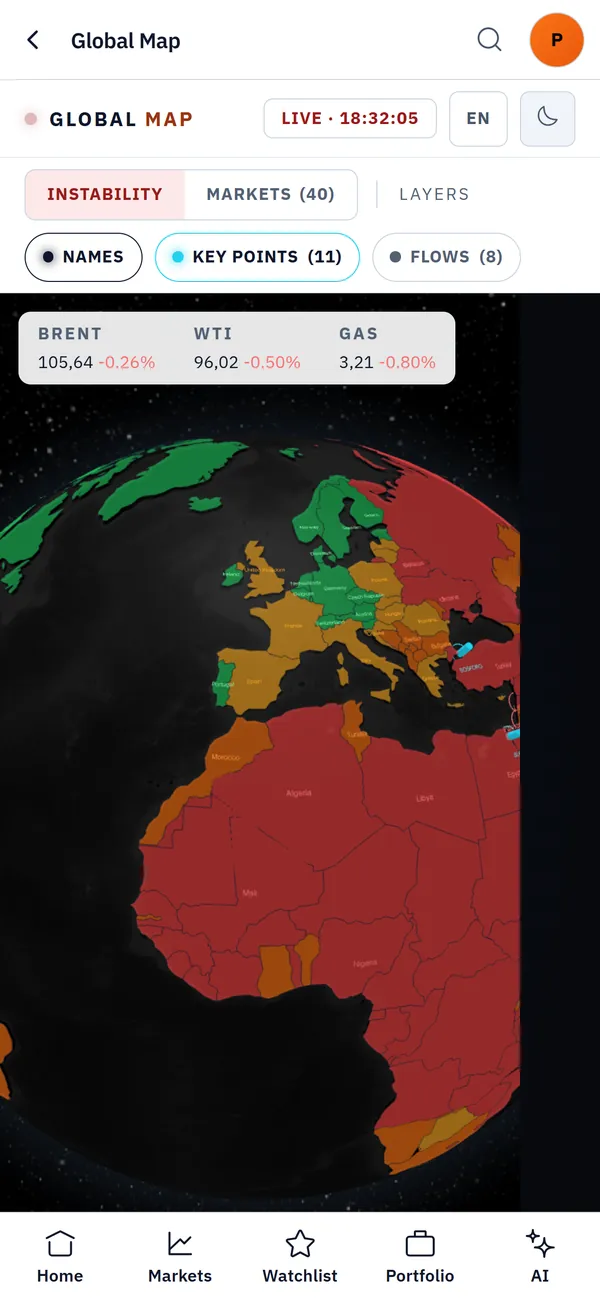
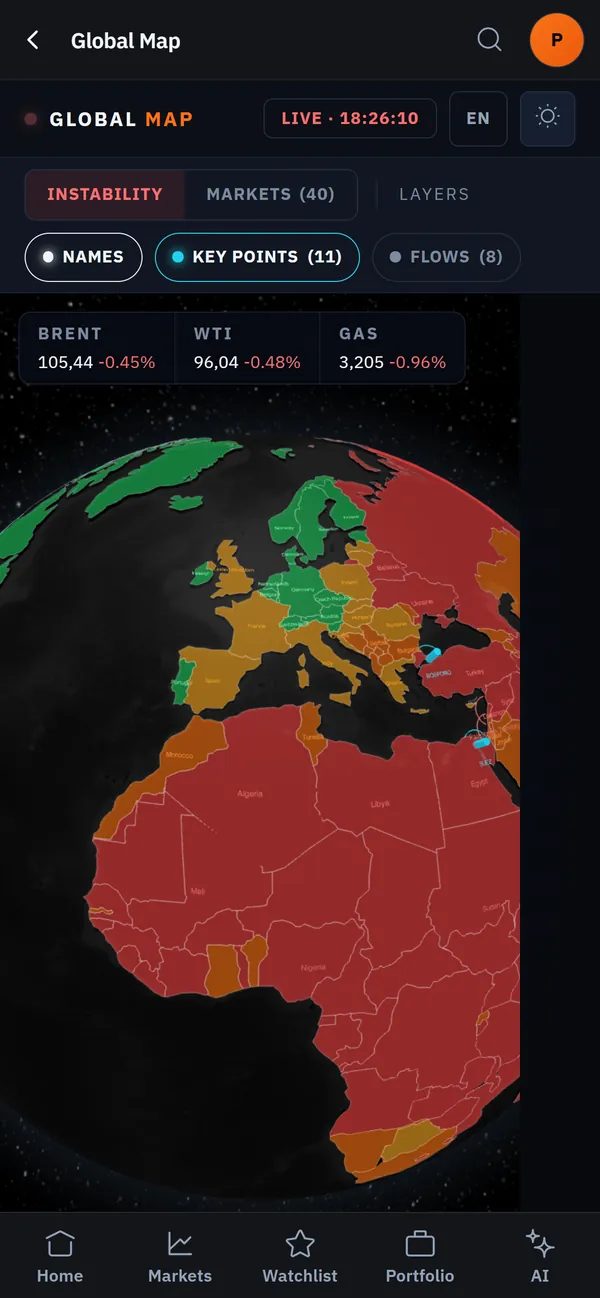
One map. All your markets.
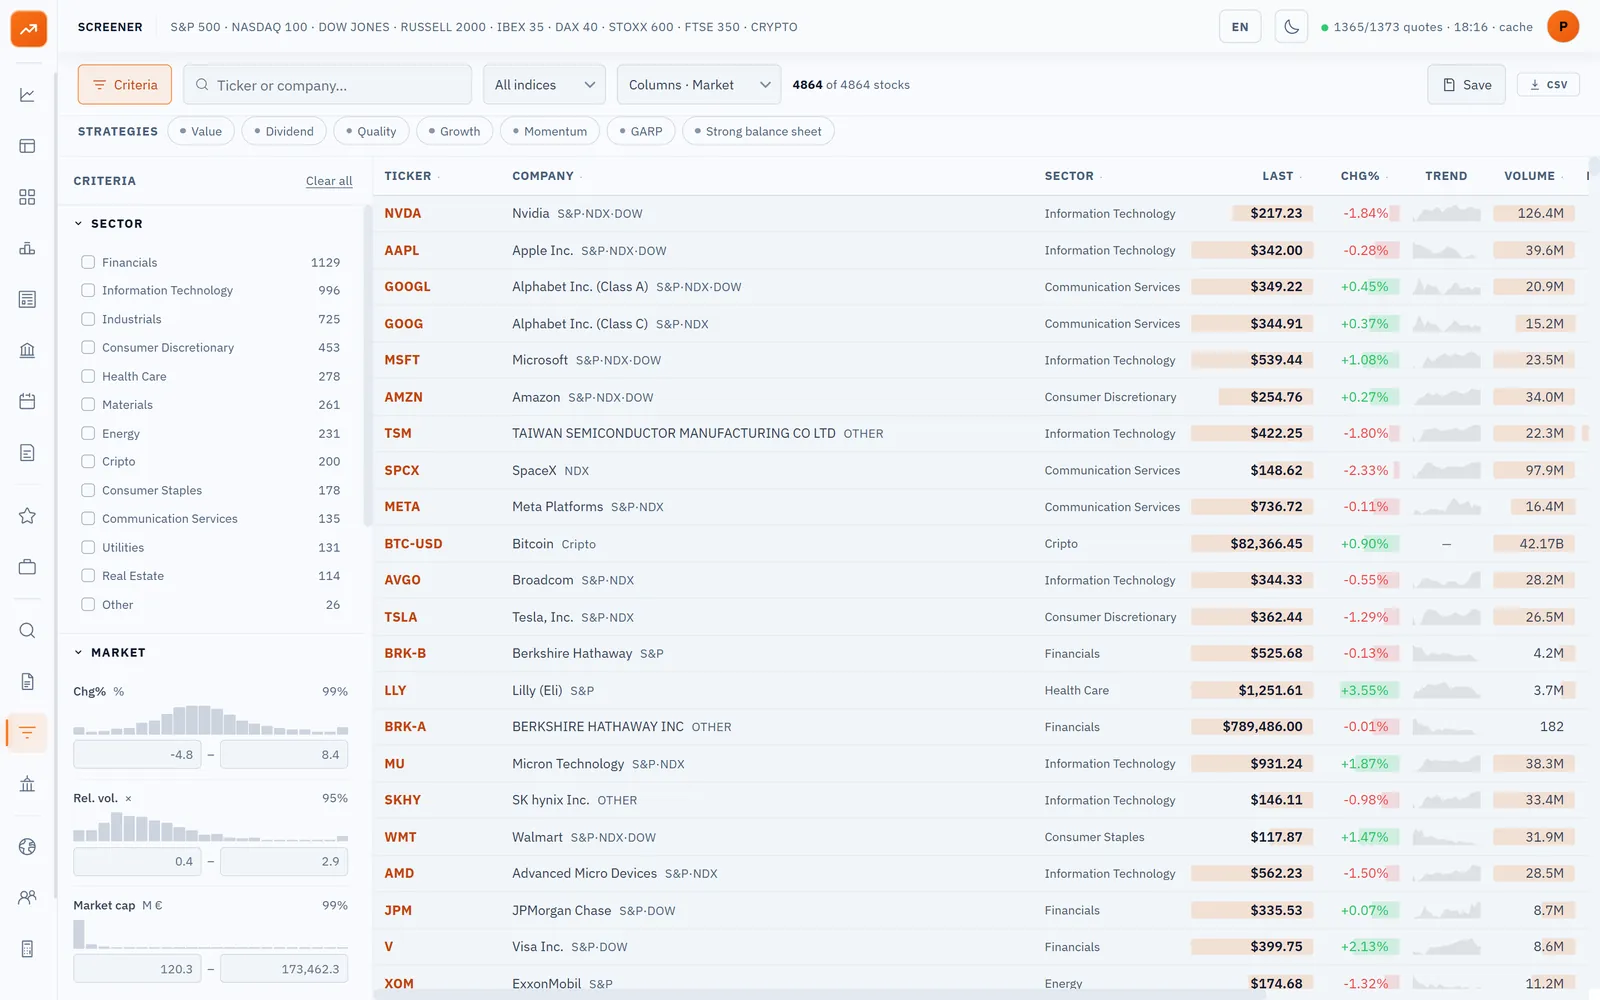
Full coverage (company page, fundamentals and screener) in the US and 16 European venues. Plus stocks from more than 40 exchanges, ETFs, funds, futures, currencies, sovereign bonds from 54 countries, commodities and crypto 24/7.
See the venues
Full coverage
New York · London · Frankfurt · Paris · Zurich · Madrid · Amsterdam · Milan · Stockholm · Copenhagen · Oslo · Helsinki · Warsaw · Brussels · Vienna · Dublin · Lisbon
Futures
Chicago · New York
Quotes and indices
Toronto · Mexico City · São Paulo · Buenos Aires · Santiago · Tokyo · Hong Kong · Shanghai · Shenzhen · Seoul · Taipei · Mumbai · Singapore · Kuala Lumpur · Bangkok · Jakarta · Sydney · Wellington · Johannesburg · Tel Aviv · Istanbul · Cairo · Riyadh
New YorkLondonFrankfurtMadridChicagoTokyo
Every figure, with its date. If it does not exist, we say so.
Filling the gaps looks nicer. But the figures that do appear are only useful for deciding if you know when they are from and where they come from.
Auditable. Every figure includes date and time: it can be traced back to its source.
Real time. Live prices across US and European sessions, pre-market and after-hours included, plus crypto 24/7.
No invented data. If a line item does not exist for a company, it is flagged as missing rather than estimated.
AI over verified data. It reasons with the terminal's figures. It never fabricates prices.
Studying a company properly means hopping between places today: the price on one site, the annual accounts in a regulator PDF, the valuation in a spreadsheet of your own, and the news somewhere else again. Every hop costs time and, worse, breaks the thread of the analysis.
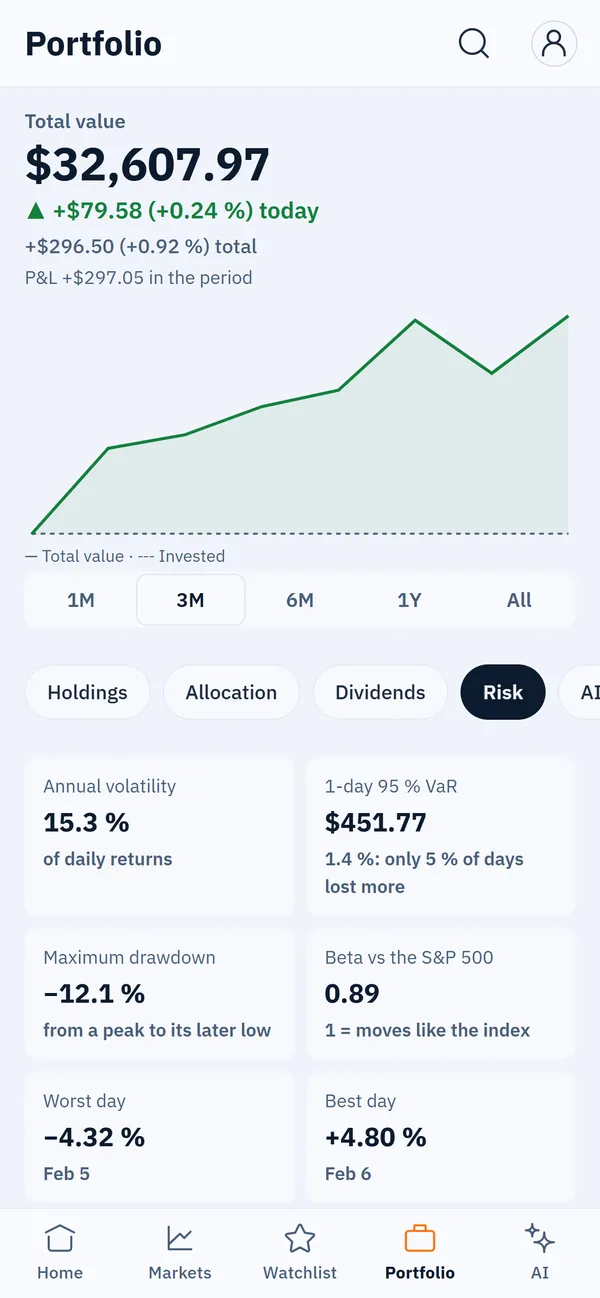
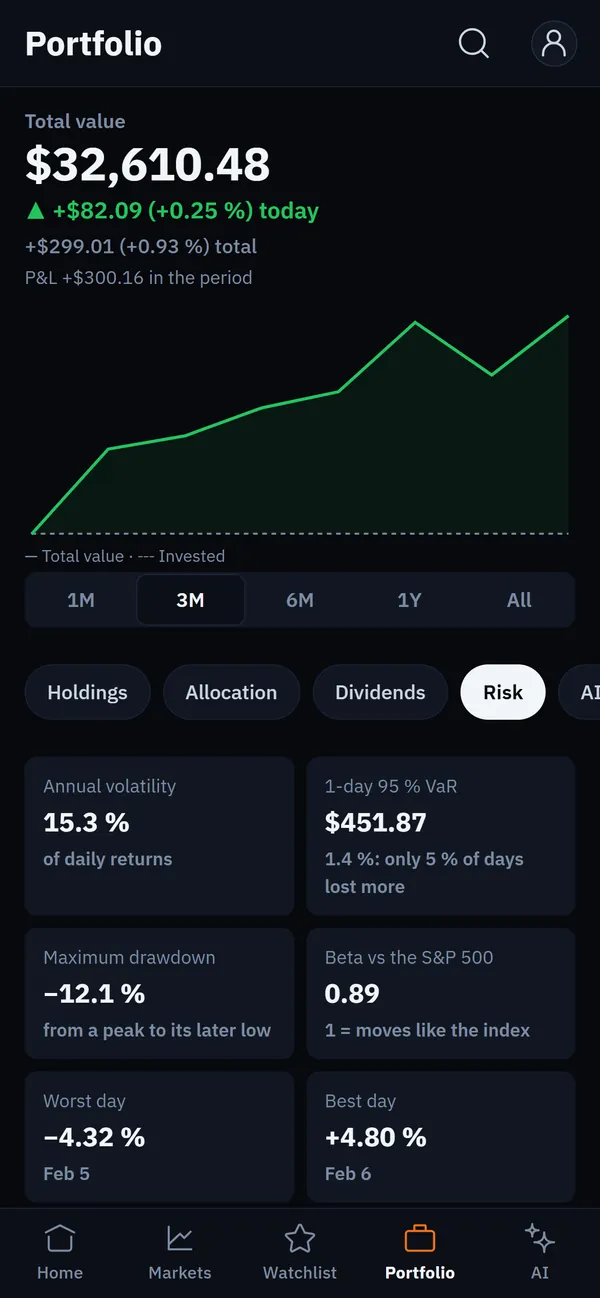
Celsmar puts that whole path on one screen: price, historical accounts with their ratios, a discounted cash flow valuation with the assumptions in plain view, a portfolio with risk metrics, and the context of news and calendar. Same company, same numbers, without starting over at every step.
How is it different from a quotes website?
A quotes website answers what a share is worth right now. Celsmar tries to answer something harder: whether that price makes sense. To do that it shows how every figure is computed, with its date and its time, and lets you move the valuation assumptions to see how much the result changes.
There is also one rule that is not up for negotiation: when a data point does not exist for a given company, it is flagged as missing rather than estimated. That looks worse than filling every gap, but it is the only way the figures that do appear can be used to decide anything.
Start free. Pay when you need it.
Free
€0
To get to know the terminal. 2 AI reports a month, no card.
Pro Most popular
€12.95 /month
€10.36/month billed annually (€124.30/year). PDF reports, alerts and portfolio risk.
Enterprise
€49 /month
€39.17/month billed annually (€470/year). For professional use.
No card to start · Cancel anytime · Available worldwide, on mobile too · Compare plans →