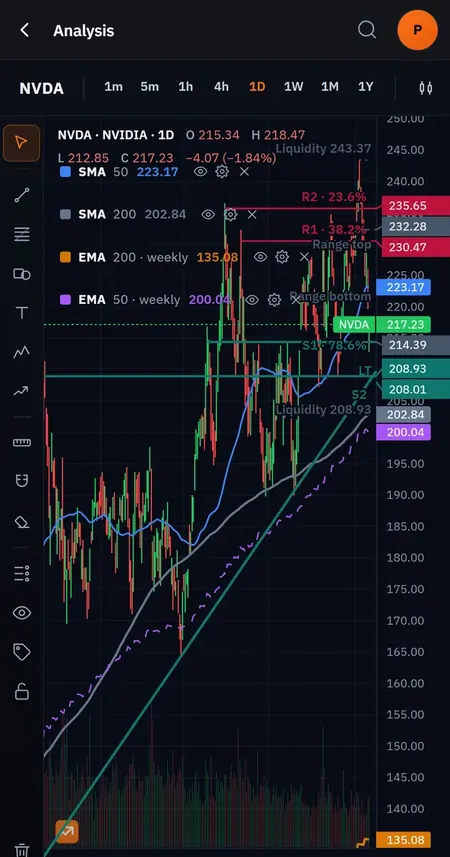
Professional charting
See details
- 40+ drawing tools: lines, fibs and shapes
- 30+ indicators: RSI, MACD, Ichimoku, SuperTrend…
- 10 chart types, incl. Renko, Kagi and P&F
Real screenshot · 15 Oct 2026
Fourteen sections on the same data: 30,000+ assets from more than 40 exchanges, up to 20 years of accounts per company and an AI that explains what it sees.
Free, with 2 AI reports a month. Pro from €10.36/month billed annually.
Real screenshot · 15 Oct 2026
Real screenshot · NVDA technical reading · 15 Oct 2026
Real screenshot · 15 Oct 2026
Real screenshot · 15 Oct 2026
Real screenshot · 15 Oct 2026
Real screenshot · 15 Oct 2026
Real screenshot · 15 Oct 2026
Real screenshot · 15 Oct 2026
Real screenshot · 15 Oct 2026
Real screenshot · 15 Oct 2026
1 of 14
Professional charting
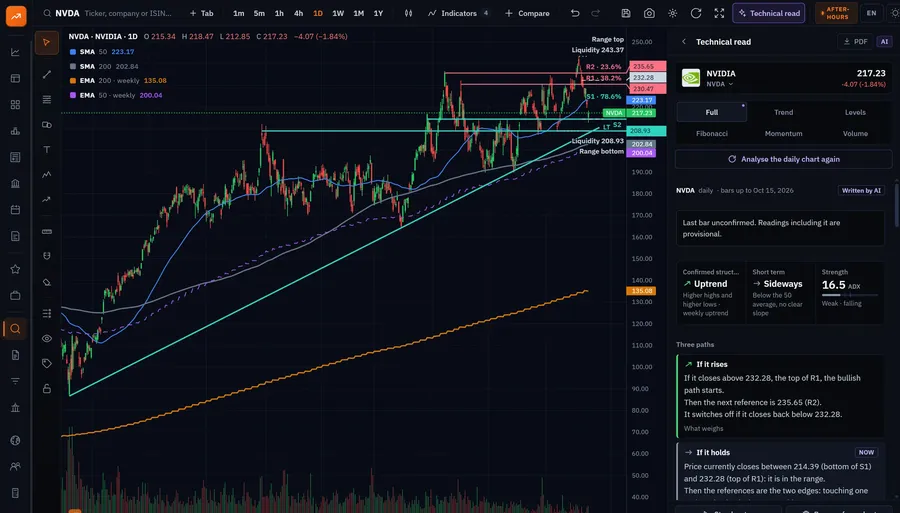
Real screenshot · 15 Oct 2026
DCF valuation
DCF valuation
Bear, Base and Bull on real cash flows, and what growth the price implies.
Multi-agent AI
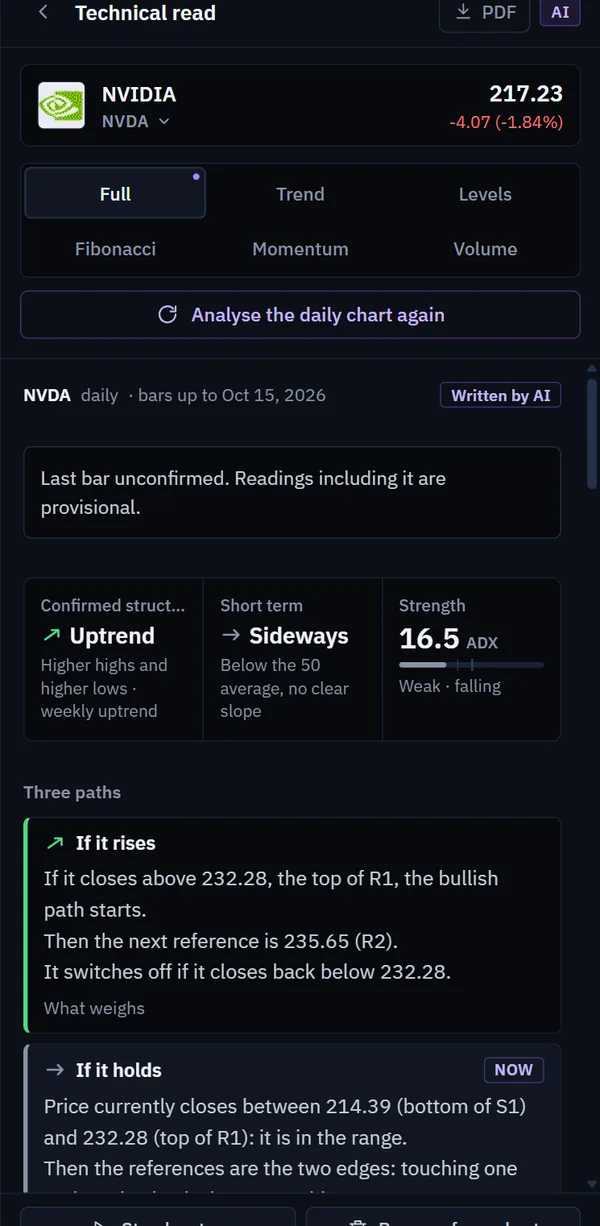
Real screenshot · NVDA technical reading · 15 Oct 2026
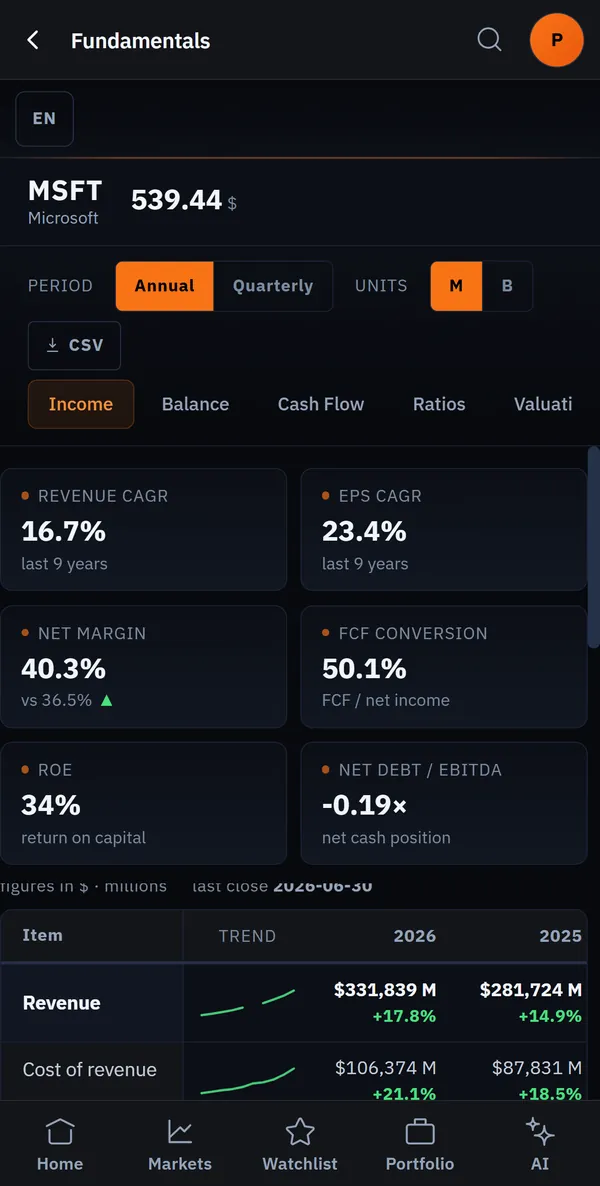
20 years of fundamentals
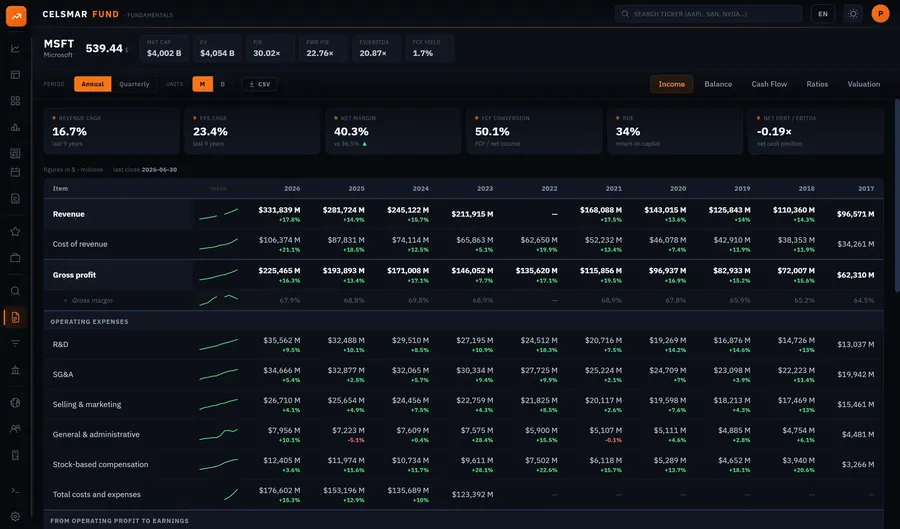
Real screenshot · 15 Oct 2026
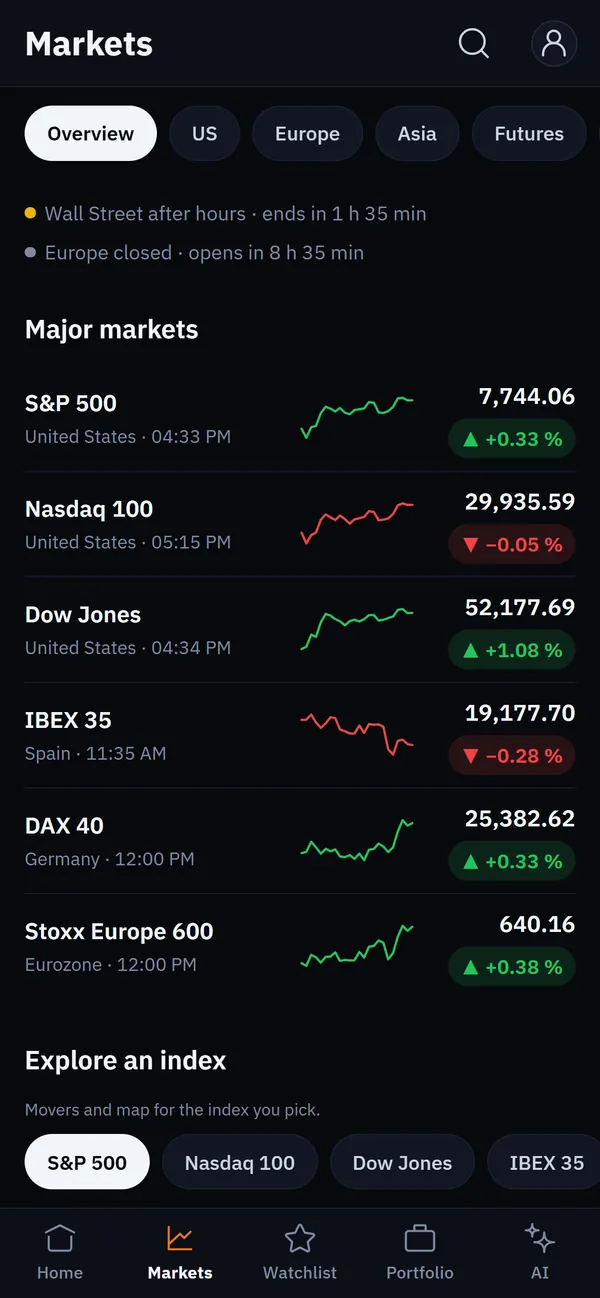
Markets
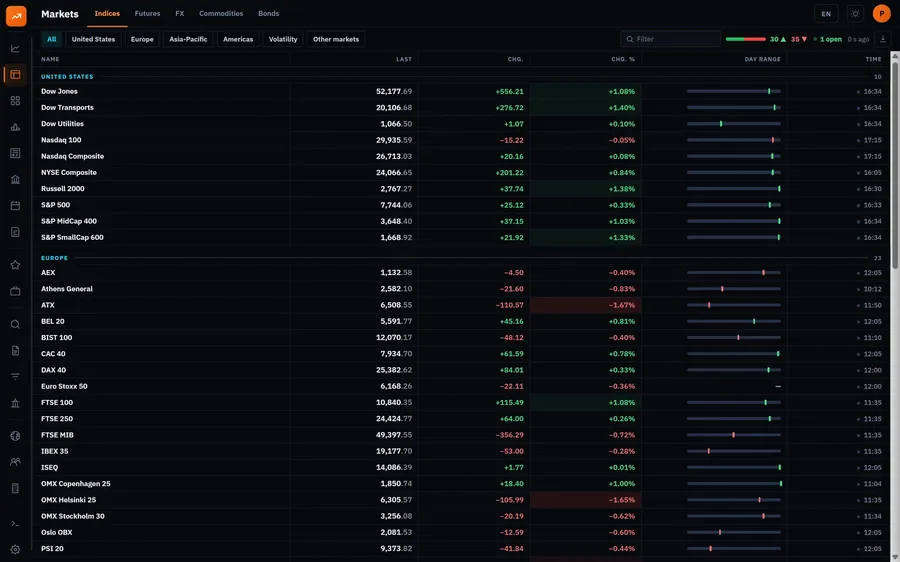
Real screenshot · 15 Oct 2026
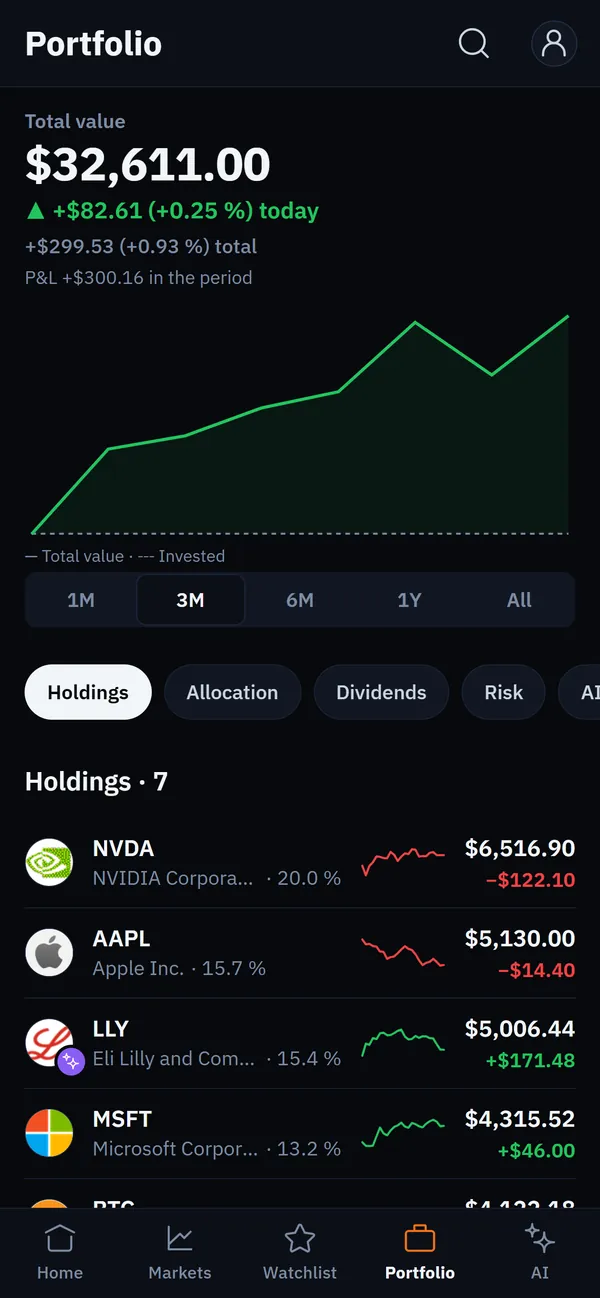
Professional portfolio
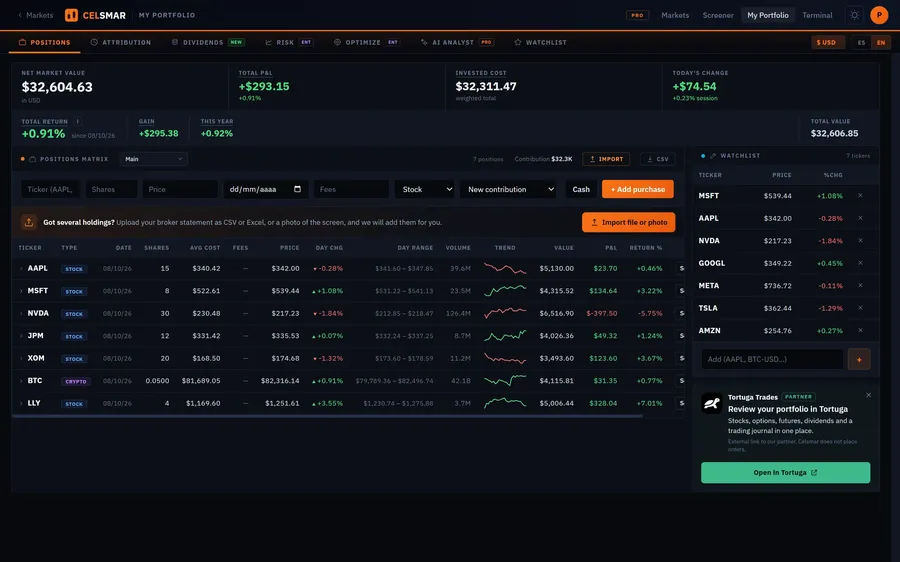
Real screenshot · 15 Oct 2026
Dividend income
Dividend income
What your portfolio collects, month by month and holding by holding.
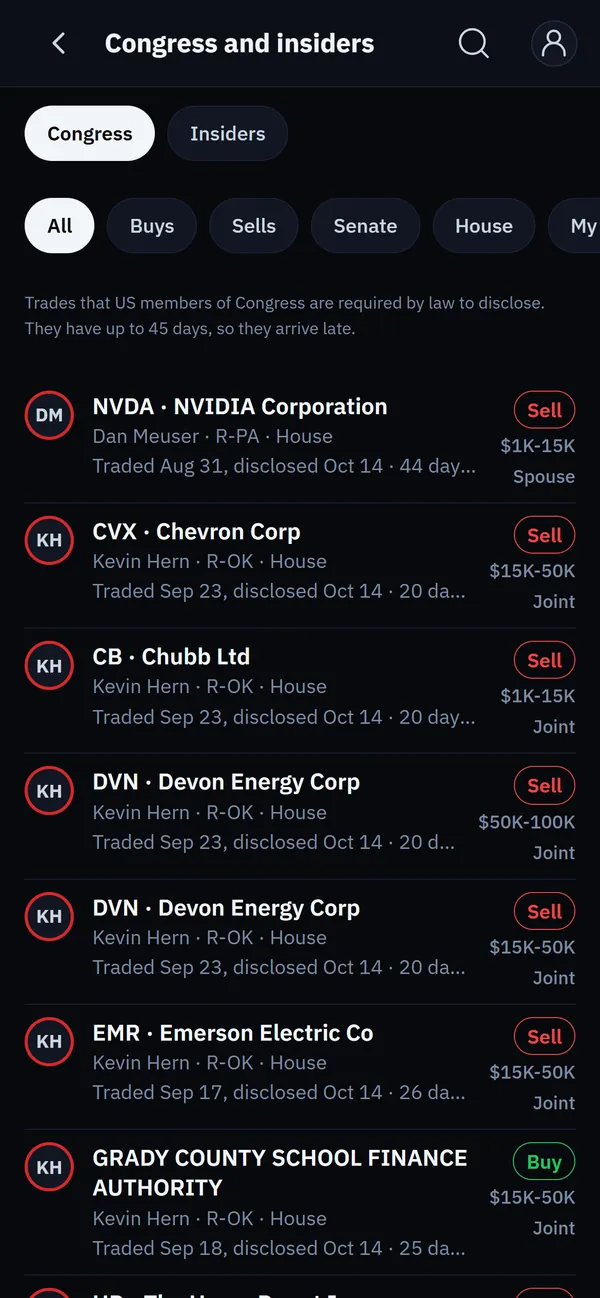
Smart Money
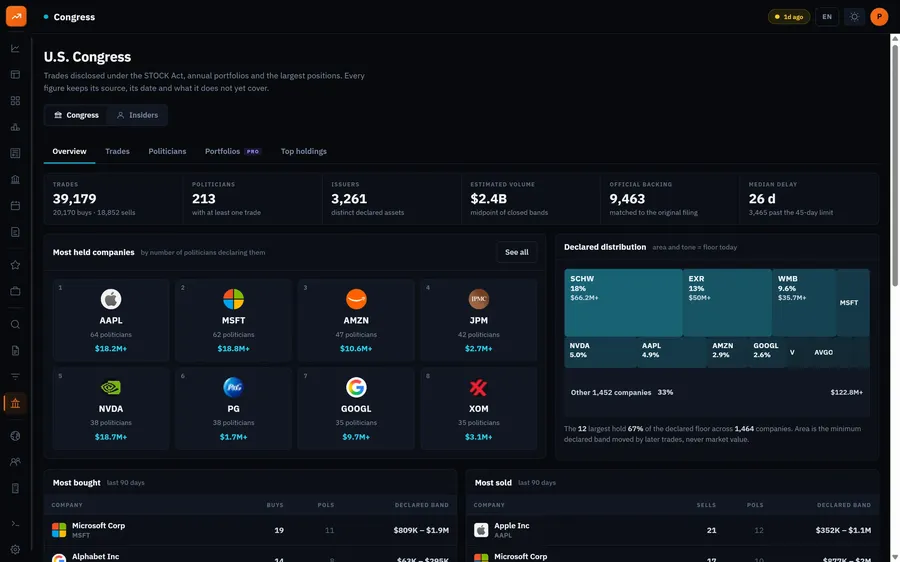
Real screenshot · 15 Oct 2026
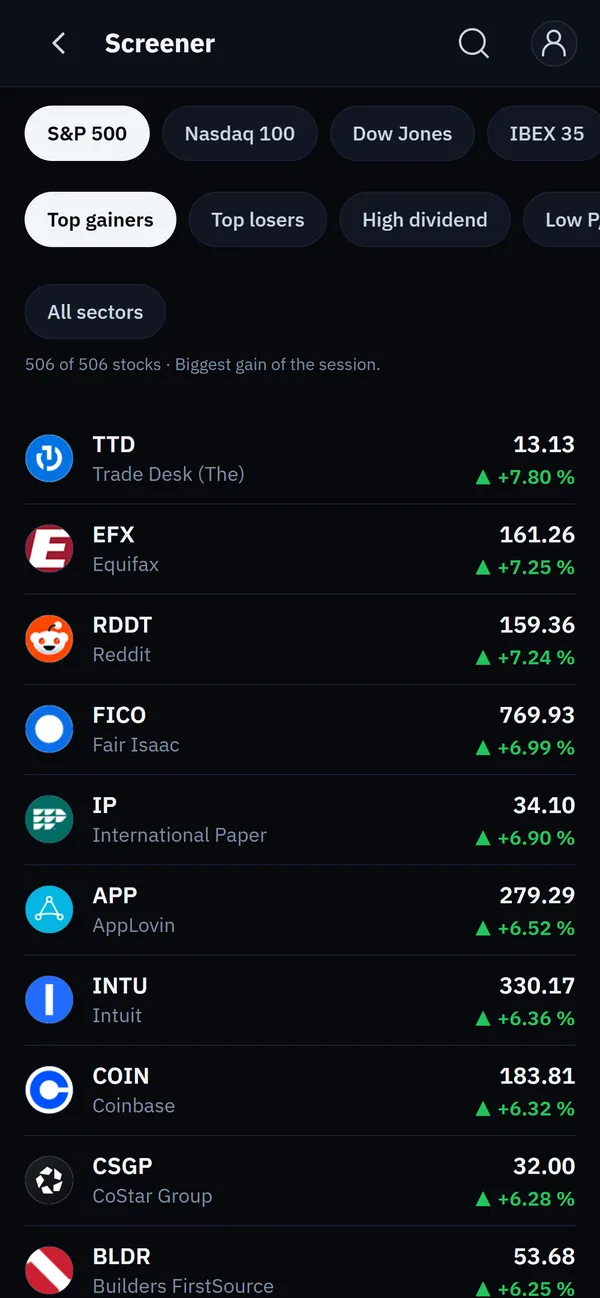
Screener and watchlists
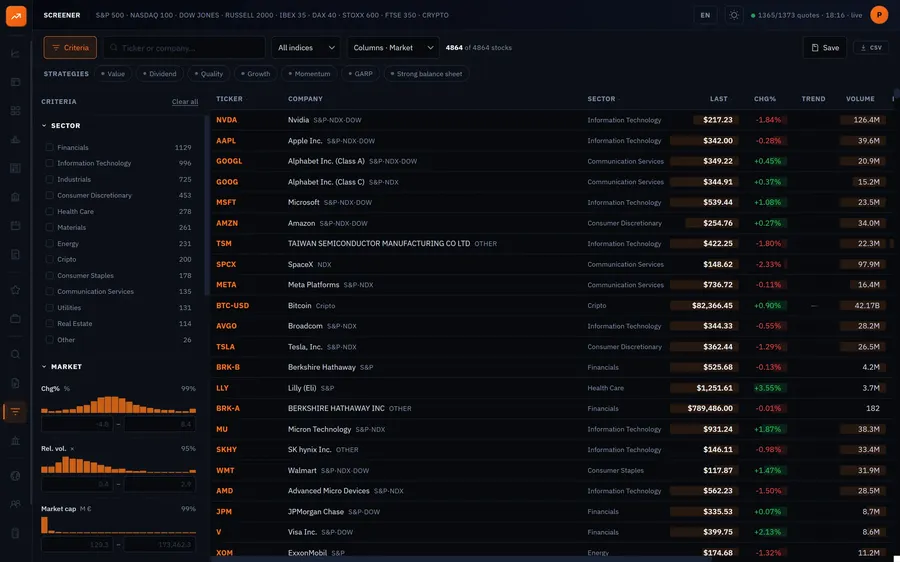
Real screenshot · 15 Oct 2026
Backtesting
Backtesting
Simple strategies on real history, with no look-ahead.
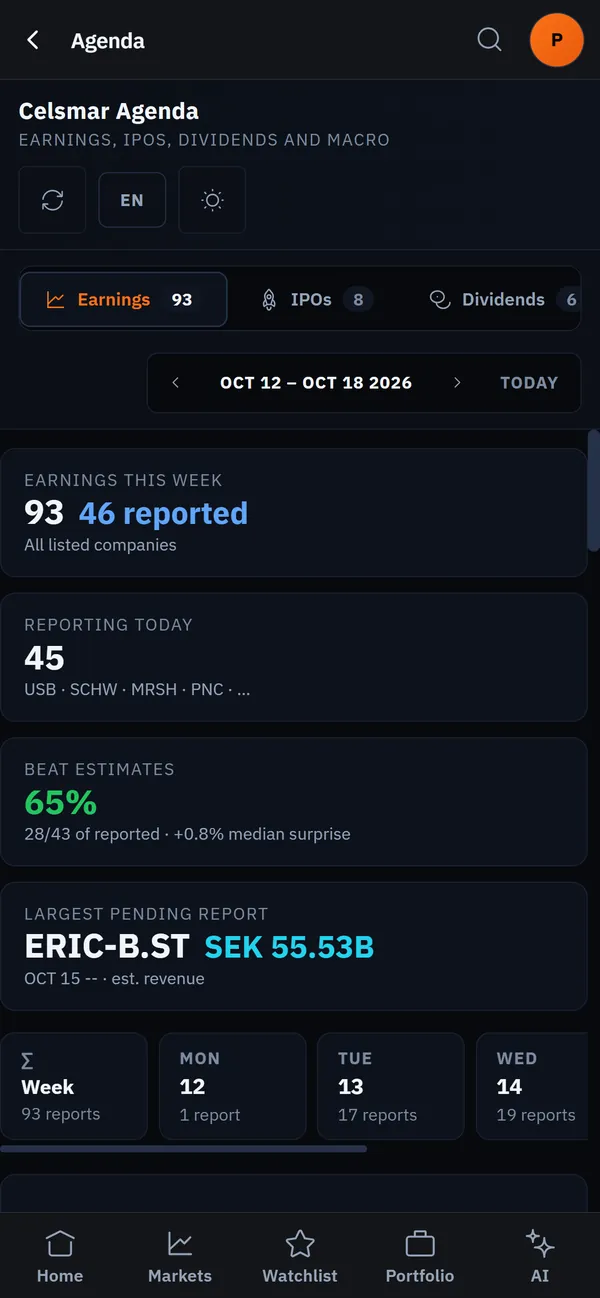
Earnings, IPOs and macro
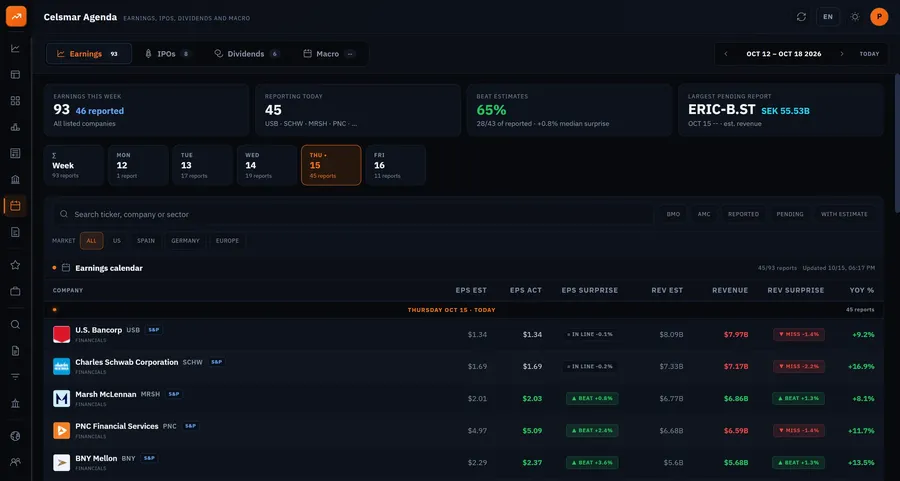
Real screenshot · 15 Oct 2026
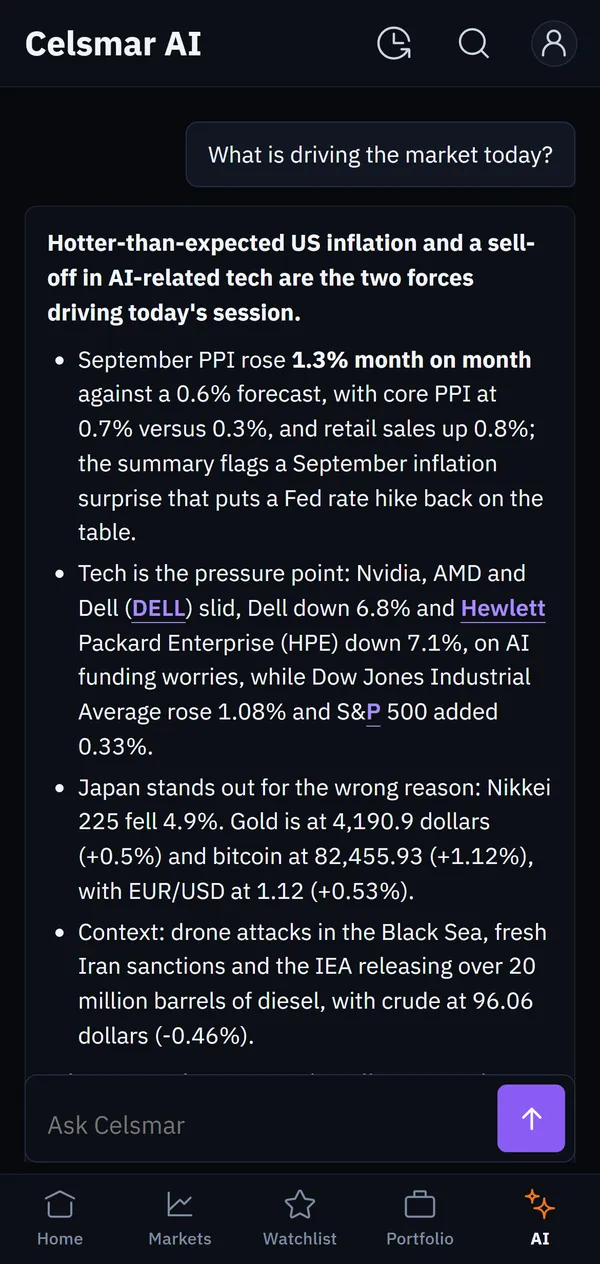
News with judgment
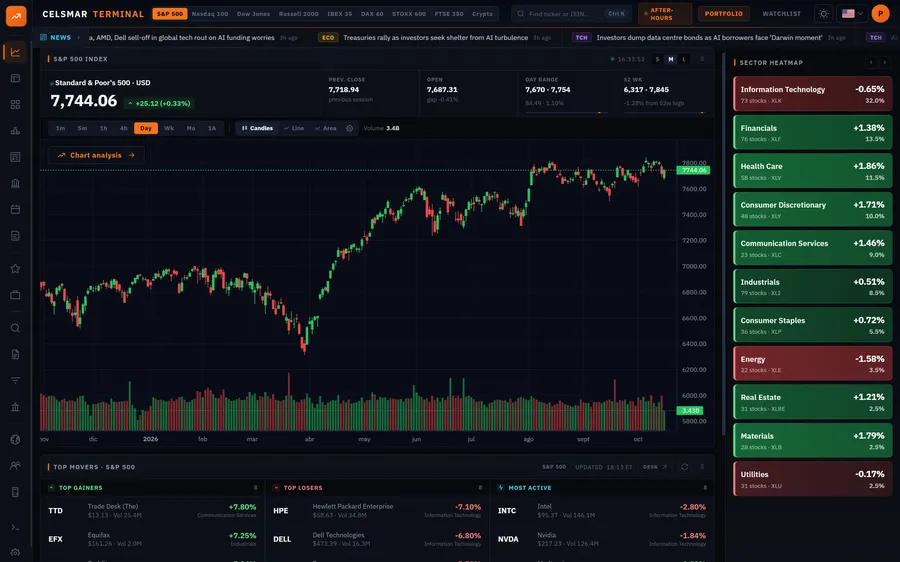
Real screenshot · home dashboard · 15 Oct 2026
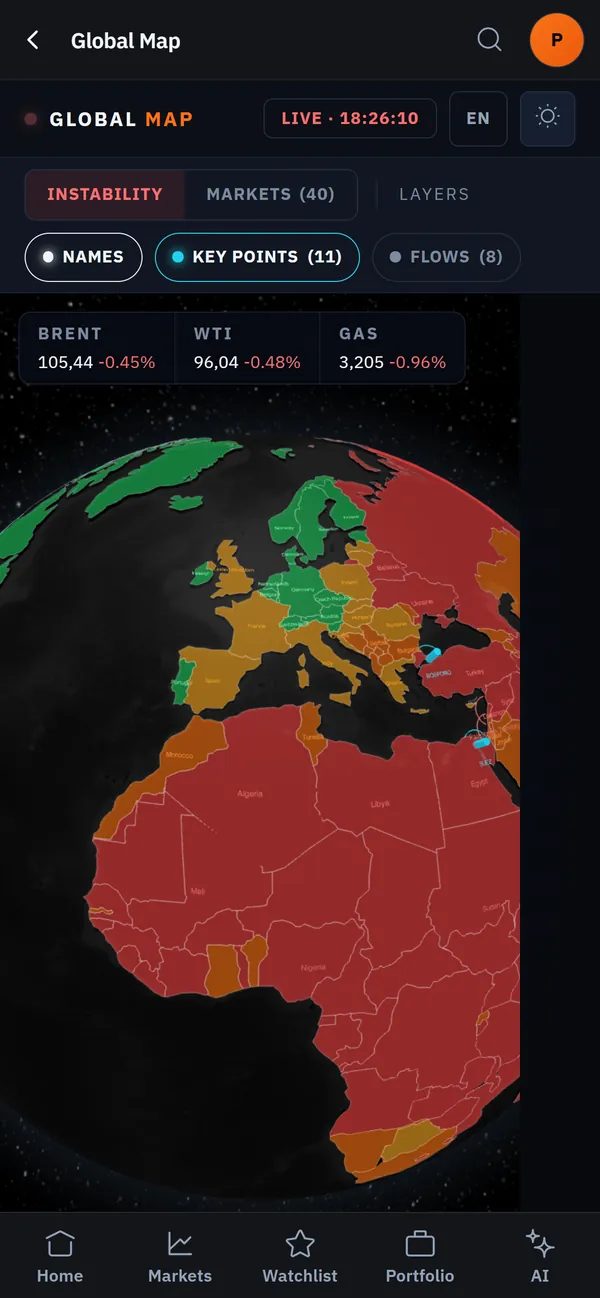
World map
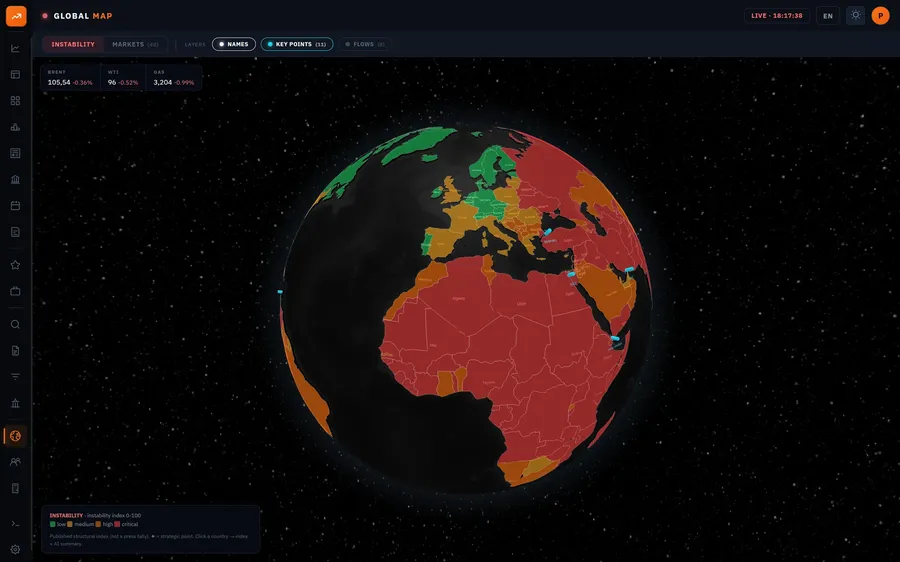
Real screenshot · 15 Oct 2026
Calculators and crypto
Calculators and crypto
Six calculators connected to your portfolio, and crypto as one more asset.
Every report sets thirteen agents to work: four analysts research in parallel, the bull case is argued against the bear case and a manager signs the verdict.
2 reports a month on the free plan.
How a report is madeReal screenshot · 15 Oct 2026
Every figure carries its date. If it is an estimate, we say so. If it is live, you will see it marked. Nothing invented: when a figure does not exist for a company, it shows as missing.
| Data | Origin | Frequency | How you will see it marked |
|---|---|---|---|
| Accounts and fundamentals | Accounts filed by the company | Quarterly and annual | With the period date |
| Rates, inflation and GDP | Official series | At the latest print | With the release date |
| Insider moves | Declared trades | When published | With the verified title |
| Price | Market | Live or at the close | "Live" or "15 Oct close" |
Celsmar is a stock research terminal that runs in your browser and brings together on one screen what is usually spread across several tools: quotes, financial statements, valuation, portfolio and analysis. It is built for the individual investor who wants to study a company properly without paying for a professional licence.
What sets it apart from a quotes website is the full path. It does not just show the price: it shows where every figure comes from, how that turns into a valuation, and what is left once the case for and against have been weighed against each other. All of it runs on verified data, and when a figure does not exist for a given company it says so, rather than filling the gap with an estimate. It runs in the browser with nothing to install, and the free plan already works on real data, not on a demo with sample figures.
Celsmar does not execute orders, does not manage money and does not give personalised recommendations. It is not an investment services firm and it is not supervised by the CNMV: it is an information and analysis tool, and the decision to buy or sell always belongs to the person using it.
Nor does it predict the market. A discounted cash flow valuation is the result of a specific set of assumptions, not a forecast, which is why those assumptions are visible and editable: anyone can check how much the result moves when they change. And it does not invent data. When a figure is not available for a company, it is flagged as missing instead of being estimated. It does not hold money either, and it does not connect to your broker: you enter the portfolio positions yourself, and they are there to measure, not to trade. The detail is in the legal notice.
In Celsmar you open any asset in the covered universe and work it end to end. You read its historical accounts with the ratios already computed, value the company with a discounted cash flow while moving the assumptions, filter its sector with a screener, and track the position in a portfolio that computes return and risk from your actual holdings.
On top of that comes the context: earnings calendar, news with its source, insider and institutional activity, technical indicators, and strategy tests over past data. The point is not to have twelve separate tools, but to have each one pick up where the last left off, on the same company and the same numbers. The covered universe is over 30,000 assets: stocks from 40+ exchanges, thousands of ETFs and mutual funds and the largest cryptocurrencies.
Celsmar is built for people investing their own money who want to understand what they are buying: someone who can already read an income statement, or wants to learn how, and who until now has been splitting that work between a quotes website, a spreadsheet and a few forums.
You do not need to be a professional analyst. The technical terms that appear on screen are explained in an open glossary, and valuations come with their assumptions in plain view so they can be argued with. Anyone looking for automatic buy and sell signals, or for someone else to manage their money, will not find that here: the tool supports the analysis, it does not replace it. The free plan is enough to study companies one at a time; the paid plans extend the history available and the number of reports per month.
No card. 2 AI reports a month. Cancel anytime.