Product How it works Pricing FAQ About Contact

What's new

Everything landing on the platform, dated and in detail. Celsmar is built in public: this is the latest.

7 September 2026

Markets: currencies, bonds, commodities, indices and futures NEW

The platform knew a great deal about a company and very little about the world it trades in. You could read a balance sheet twenty years back and still had no way to see where the barrel was, or what government debt pays at ten years, which is the rate any valuation is discounted at.

Markets is a new section with five desks: currencies, bonds, commodities, indices and futures. Close to 460 live markets, sortable by any column, with the daily move, the session range and the 52 week range, and the chart of any row one click away.

Government debt, from 54 countries. From the one month tenor to the fifty year one, with each issuer's full curve and the history of every tenor. Each yield is checked against a second reading before it is published, and if the two disagree it is not shown: we prefer a gap to a number we cannot stand behind. For the issuers whose daily series nobody publishes, we record it ourselves from day one, and the screen always says which kind of series you are looking at.

Commodities, with their forward curve. A barrel at 91 says nothing on its own. At 91 with the next contract cheaper it is physical scarcity; at 91 with the next one more expensive it is oversupply. That curve now sits on every commodity, and the price shown is the contract where the trading actually is, not whichever one the calendar points at.

Currencies, indices and futures round out the desks: 42 pairs with their pip, the indices of the world's main exchanges and futures with their expiry in plain sight. And every asset class finally has its own profile: a barrel of crude no longer shows earnings per share or margins, because it has none.

On every plan, the free one included. CSV export stays on Pro.

31 August 2026

Fundamentals, rewritten from top to bottom NEW

The section goes from thirty line items to one hundred and fifty, grouped into blocks each with its own view. Alongside them come 57 ratios across 8 families, from profitability and margins to earnings quality and cost structure.

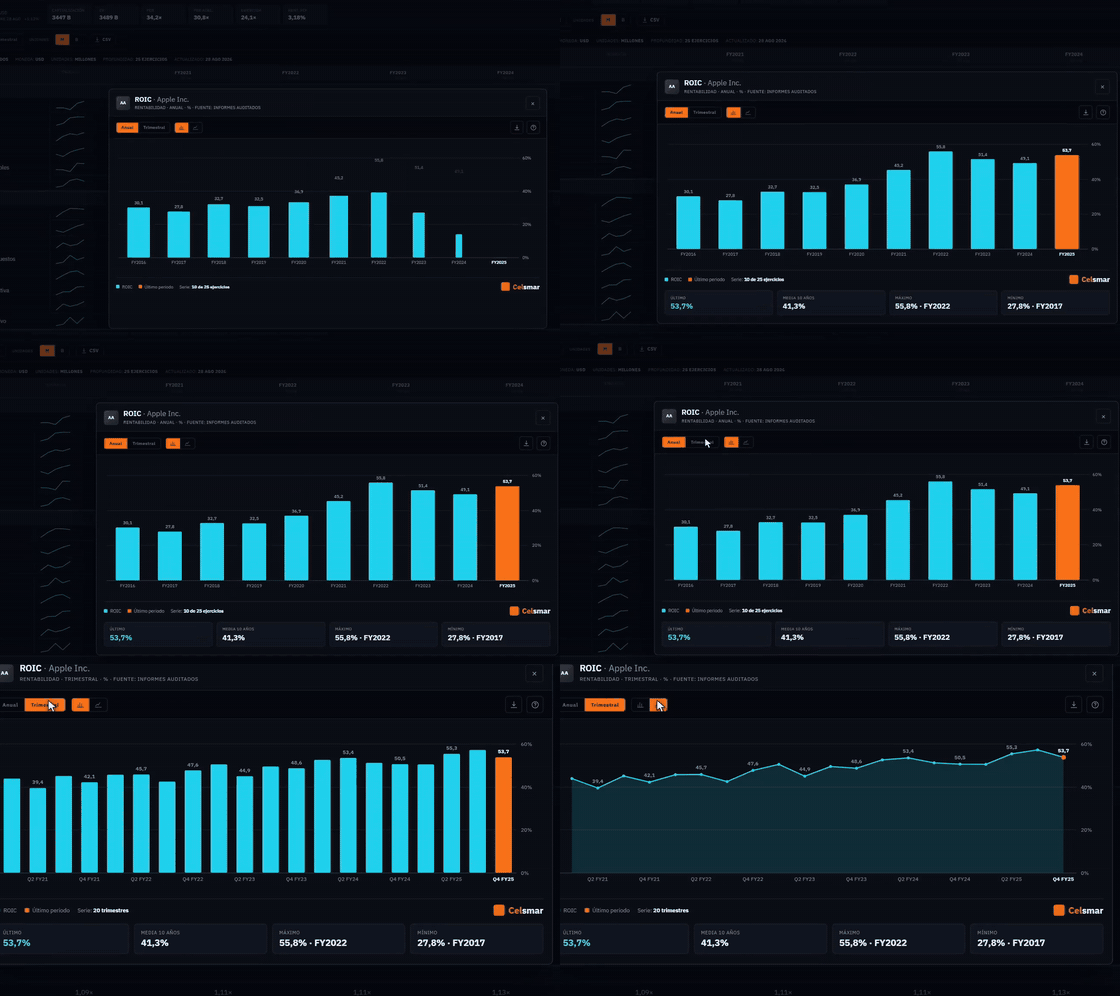
What changes the day to day most is that every figure now opens. Tap a line item or a ratio and its historical chart unfolds: bars or line, by financial year or by quarter, with the latest reading, the ten year average and the high and the low with their dates right underneath. Without leaving the screen.

In Valuation, multiples stop being a number on their own. Each one sits on its own ten year range with the current reading marked, because a P/E of 34 says nothing until you know whether that is high or low for this company. The 22 multiples are grouped by family on one shared grid, and market cap and enterprise value move out of it into the top bar, where they open their own chart too.

Underneath there is a quality check that reviews every response before it is shown: accounting identities that have to balance, signs, ranges and composition. Twenty figures that were wrong have been corrected. And the trend column no longer spreads periods across the width while ignoring the gaps: the axis follows the position of the period, and the line breaks where a figure is missing instead of crossing it with a slope nobody measured.

Free: five years of history. With Pro: ten. With Enterprise: twenty five.

Apple's ROIC opening as a chart: first bars by financial year, then a line by quarter, with the latest reading, ten year average, high and low.
Any ratio, one click away from its own historical chart.
31 August 2026

Earnings, the moment they are published

When a listed company publishes its results, the screen updates on its own within seconds. No refresh, and no waiting for the figure to travel through someone else first.

Earnings per share is read from the press release itself rather than from a later estimate, and it is only published when the keys in the document agree with each other. If they do not, we would rather show nothing. Coverage reaches the entire US market and more than 150 European issuers.

22 August 2026

Dividends in your portfolio NEW

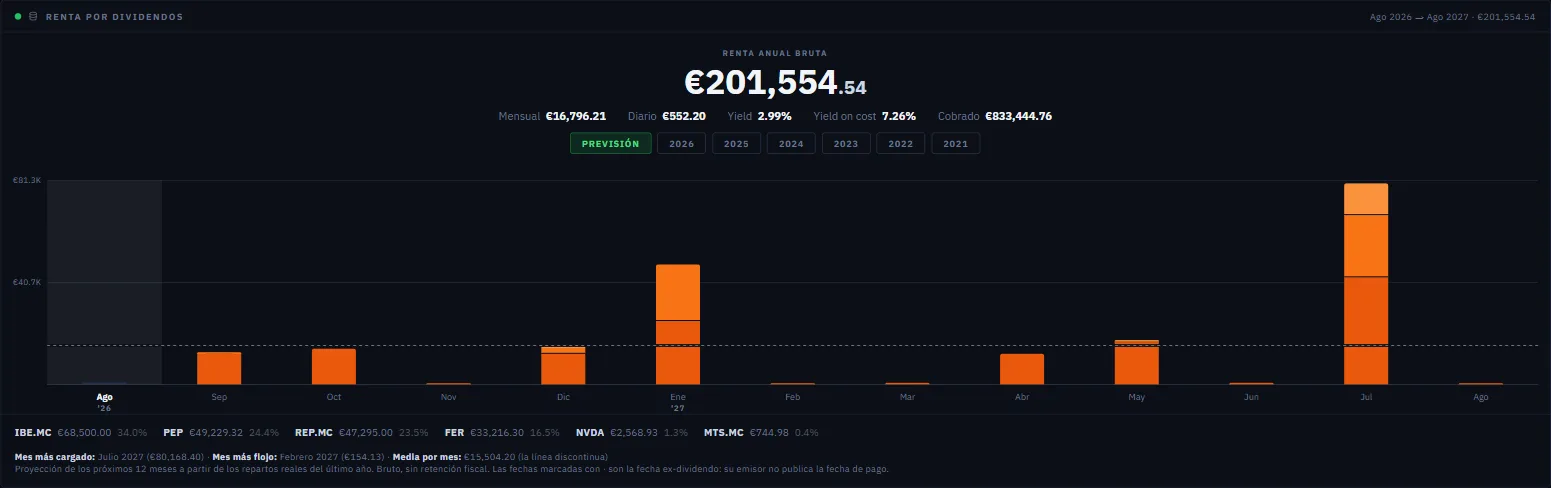
How much your holdings pay and which month each euro lands. The portfolio gets a section of its own: annual, monthly and daily income, dividend yield and yield on what you actually paid, plus a month-by-month calendar with payouts split by payer.

Looking back, the statement: one row per payout, with the shares you actually held on the ex-date, the payment date and the amount. Payouts are attributed purchase by purchase — only lots bought before each ex-date count — so the figure matches your bank rather than an average. And when two periods are not comparable, no percentage is drawn: better nothing than a number that means nothing.

Plus the health of the payout: three- and five-year growth, consecutive years of increases, how much of earnings is being paid out and a warning if there was a recent cut. Every figure is gross, because withholding depends on the issuer's country and on yours.

Free: the chart of years already collected, the per-holding table and the statement of what has been paid, on up to 8 holdings. With Pro: the twelve-month forecast, upcoming payouts, dividend health and the whole portfolio.

The Dividends section: gross annual income and a month-by-month payout calendar, with the holdings paying each month.
A portfolio's payout calendar: how much lands each month, and who pays it.
22 August 2026

Fundamentals: every figure says when it is from

Every figure in Fundamentals now carries its period right next to it — twelve months to a given month, latest quarter or closed financial year — in plain sight instead of hidden in a tooltip. Before, you had to work it out.

Underneath there are three deeper fixes. The balance sheet is ordered by closing date rather than filing date, so cash can no longer be showing the previous year's comparative. The "twelve months" window requires four consecutive quarters, with none skipped. And a quarter's earnings per share is the same in the terminal and in Fundamentals, taken from the report itself rather than from an adjusted figure that measures something else.

The fourth quarter is also added — it was missing from the series because it lives inside the annual report — along with quality ratios: return on invested capital and on capital employed, net debt to operating profit, and the share of earnings paid out as dividends. Full balance sheet and cash flow statements now reach hundreds of European listings that only had an income statement.

16 August 2026

Earnings and financial history NEW

Search a ticker in the calendar and you will see up to the last four reports, not just this week's date. Each row says whether it beat or missed consensus — on earnings per share and on revenue — and where the figure comes from.

In the terminal, Financial History lets you pick the unit (auto, millions or billions), shows year-on-year growth and never compares a reported result against a consensus that measures something else. Charts for several Spanish listings have their full history back.

12 August 2026

Economic calendar NEW

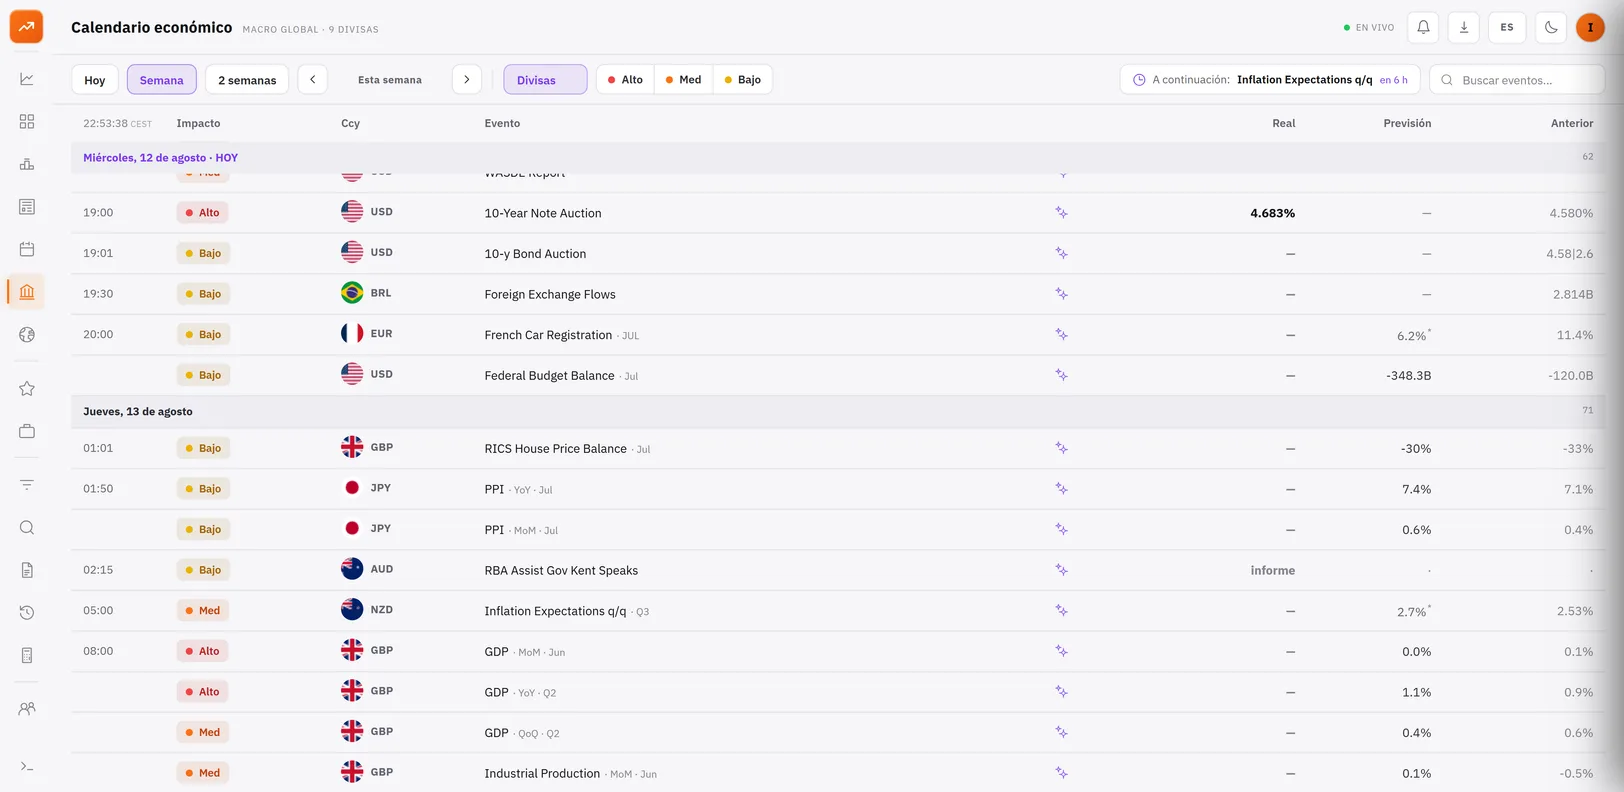
Every macro release comes with the published figure, the consensus, the previous reading and the surprise against expectations, sorted by impact and shown in your own time zone.

Open any indicator and you will see what it measures, why it matters and what it tends to move, alongside the implied probability of the next rate moves and the measured historical reaction of equities, currencies, gold, bonds and crypto to that same release.

Economic calendar: the week ahead with impact, consensus and the published figure.
The week ahead, with impact, consensus and the figure that just printed.
12 August 2026

The platform, redesigned for mobile NEW

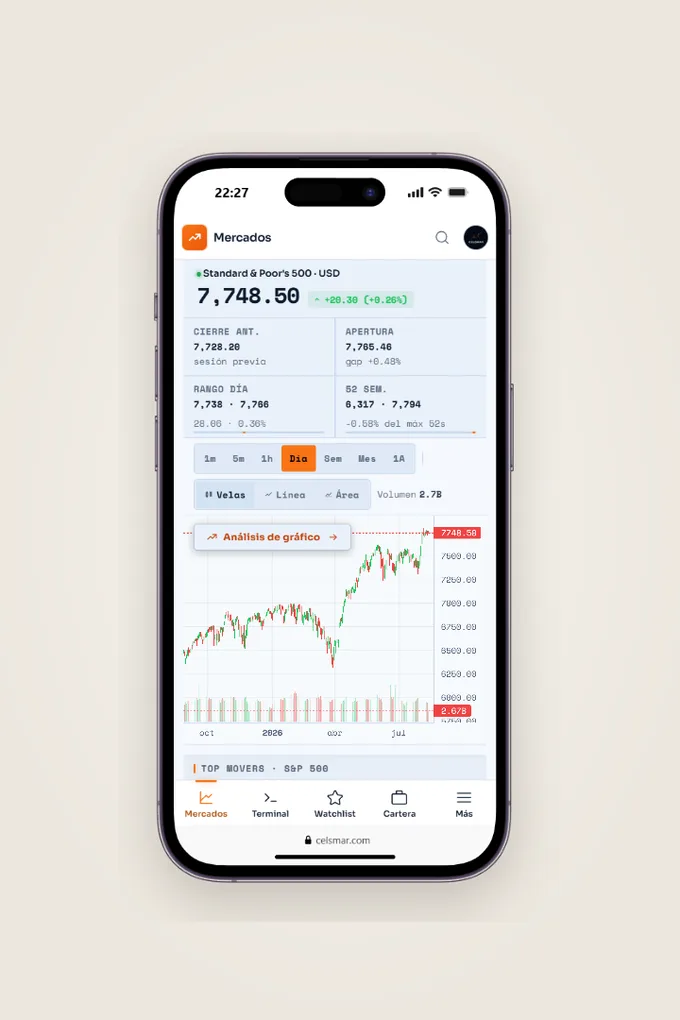
The whole app now has its own version for small screens: a bottom navigation bar, a full-screen search and tables that reflow into readable cards instead of forcing you to drag sideways.

Same data, same account, nothing given up for fitting in your pocket.

The platform on a phone: quote, candlestick chart and the bottom navigation bar.
The same account, in your pocket: bottom bar, full-screen search and tables that reflow into cards.
12 August 2026

New typeface NEW

The whole platform —terminal and public site— now uses a single self-hosted type family, built to keep figures aligned in columns without dressing the interface as code. The change shows on every screen, in light and in dark.

August 2026

Watchlist, search and ETFs

Your watchlist is now a working table. Switch between a price view and a fundamentals view without leaving the page: day open, high and low, volume, market cap, P/E, earnings per share, dividend yield and the 52-week range, all on the same row. Organise several lists by theme and find the same watchlist from the dashboard, the portfolio or the terminal.

One search box across the platform. The same ticker search now sits in every section: news, screener, top movers, calendar, analysis, portfolio, fundamentals and backtesting. Type a name or a symbol, see at a glance which market each result belongs to and open the asset without switching pages. Thousands of searchable symbols, including those outside any index.

ETFs get their own profile. An exchange-traded fund is no longer shown as if it were a stock: assets under management, expense ratio, net asset value, dividend yield, returns over several horizons, category and issuer, plus its ten largest holdings and the weight of each sector inside the fund.

July 2026

Financial glossary

An open glossary of the terms you will meet across the platform: from P/E to free cash flow, from drawdown to net asset value. Short, plain-language definitions in English and Spanish, no account needed.

July 2026

Community

Every stock, crypto and ETF now has its own discussion room, and every market and topic its forum. Share your view with a bullish or bearish tag, follow other investors, send private messages and check the community's aggregate sentiment on each asset. With clear rules and active moderation from day one.

July 2026

Expanded market coverage

New US and European indices as first-class markets: their constituents show up in search, the screener, top movers and the sector heatmap, with their own currency and trading session.

June 2026

Accounts and cloud sync

Your account travels with you: portfolio, watchlist, photo and preferences synced across devices, optional two-factor authentication and an account page to manage it all. The whole app works in Spanish and English.

June 2026

Deep fundamentals and calculators

Income statement, balance sheet and cash flows with years of annual and quarterly history, ratios, valuation with multiple bands, and a set of investment calculators connected to your portfolio.

May 2026

Quantitative analysis and global map

Per-asset quantitative signals, volume profile, macroeconomic calendar, institutional positioning and a global situation map to track markets and geopolitical risk at a glance.

The foundations

The terminal

Live quotes, professional charts with dozens of drawing tools and indicators, interactive DCF valuation, assisted research and a multi-market screener. The base everything else is built on.